

Dashboards for your monitors and alerts
How many alerts your monitors raise, how fast someone takes them, which monitors are noisy and which checks fail. Computed on your Mac, from your own history.
CoIsland’s Dashboards section gives you dashboards for your monitors and alerts, built from what your monitors did on this Mac. They answer what a team lead or an on-call engineer asks at the end of a week: how many alerts came in, did anyone take them, how fast, and can every monitor still check what it watches? Every connector at once, or one at a time. The figures follow each check and each alert change, and refresh once a minute.

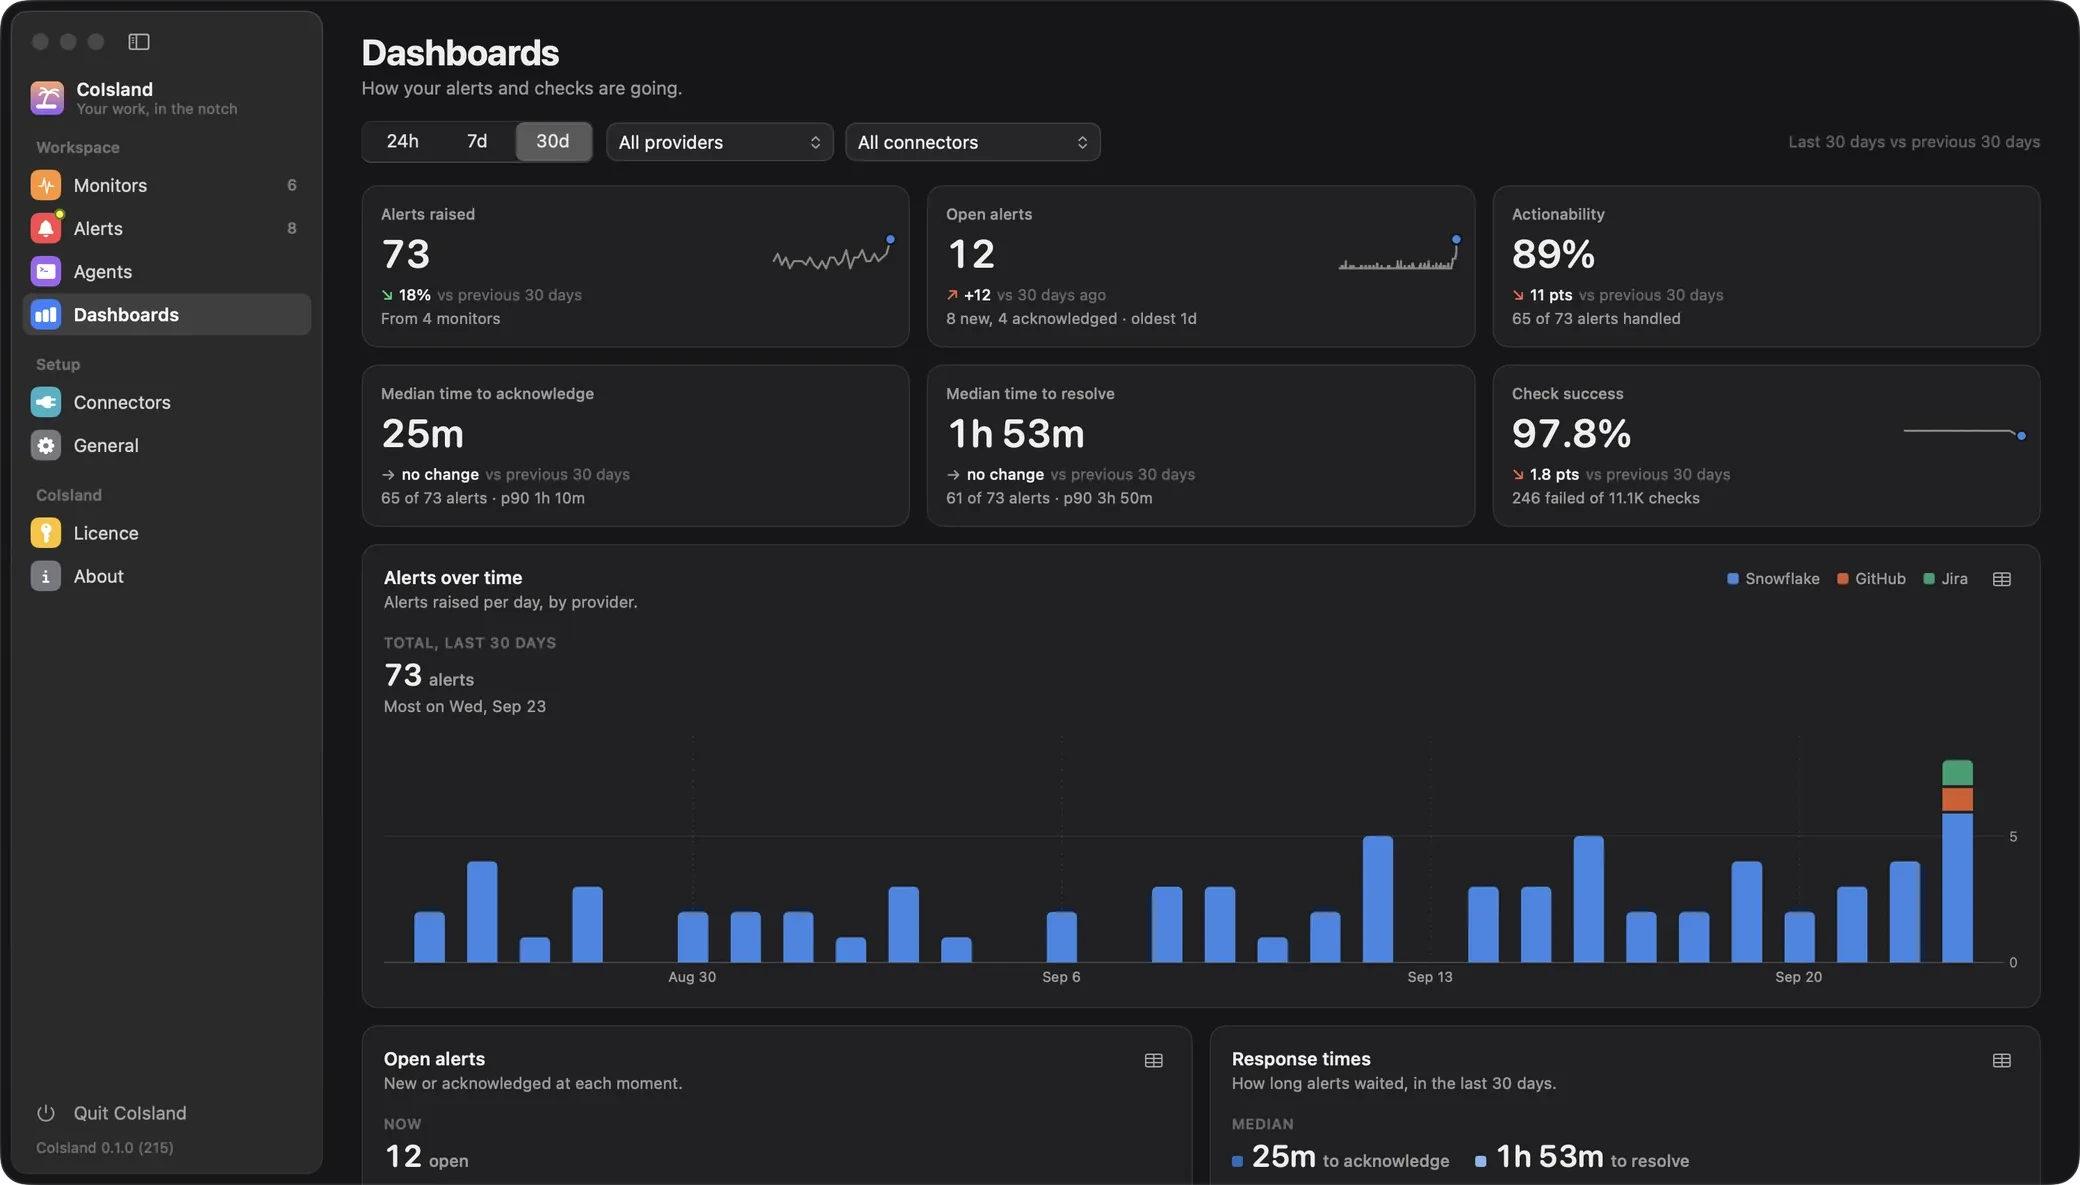
Six alert metrics at the top
Each tile compares the period with the one before. Hover one for how it is computed.
-
Alerts raised
Alerts detected in the period, and how many monitors raised them, against the period before.
-
Open alerts
New or acknowledged right now, whenever raised, with the age of the oldest. Compared with one period ago.
-
Actionability
The share of the period’s alerts that someone acknowledged or resolved. A falling share is alert fatigue.
-
Median time to acknowledge
Detection to first acknowledgement, or to resolution if that came first. Median and p90.
-
Median time to resolve
Detection to resolution, for the period’s alerts resolved now. Median and p90.
-
Check success
Checks that got an answer, of all checks. Throttled and network failures count as failed.
Pick a period and a connector
Three buttons set the period: 24h, this hour and the 23 before, charted by the hour; 7d or 30d, ending today, charted by the day. Each is compared with the stretch of the same length just before it, so a day that is half over meets an equal part of a day. CoIsland opens on 7 days and remembers your choice.
Two menus narrow everything under them: a tool, listed once its monitors have run, then one connector, such as the acme Snowflake connector. A data team can look at its warehouse alone, an engineering team at its repositories and Jira projects.
Why a median, not a mean time to acknowledge
Many tools report a mean time to acknowledge (MTTA). CoIsland shows the median and the 90th percentile, never a mean: one alert left open over a weekend would swamp a mean, while the median still says how long a typical alert waits. The p90 is always one of the real durations, never interpolated.
The period before is read as it stood at its own end, so both had the same time to respond. When it holds fewer than 5 alerts, the tile says “too few to compare” rather than swing on one alert. An alert counts as handled when it leaves New: acknowledged or resolved on its page or in the Alerts list, with Mark as seen on its monitor, or by holding its monitor’s card in the island.

Every chart, and the table behind it
Under the tiles, the charts go from broad to particular. Point at one for a readout of the hour, day or cell under the pointer.
- Alerts over time: alerts per hour or per day, stacked by kind of connector, each kind in its own color.
- Open alerts: alerts new or acknowledged at each moment, as a step line. One that climbs all week is a team falling behind.
- Response times: how long alerts waited to be acknowledged and resolved, in bins from under 5 minutes to over 3 days.
- Noisiest monitors: the 6 monitors with the most alerts, their share of all alerts and their median time to resolve. Click one to open it.
- When alerts fire: weekdays by hours, in local time. A job that fails every Monday at 06:00 stands out, and so do alerts outside working hours.
Each chart’s grid button swaps it for a table of the same numbers, which you can select and copy.
Monitor health and check success rate
A monitor that fails every check never alerts: it looks quiet while it is blind. Monitor health lists every monitor in the filter, worst first, with its checks, success rate, last error and last check:
- Failing: its last check failed.
- Degraded: its last check worked, but under 95% of its checks did.
- Healthy: 95% or more worked, the last one included.
- No checks: it did not run in the period.
Check errors counts the failed checks by cause:
| Cause | Usually |
|---|---|
| Authentication | The connector’s token was refused, or is missing |
| Permission | The token or role cannot read what the monitor asks for |
| Not found | A repository, project or object is gone or moved |
| Rate limit | The tool asked CoIsland to slow down |
| Timeout | The tool answered too late |
| Network | The tool could not be reached |
| Query | The tool refused the SQL, the search or the JQL |
| Configuration | A connector or setting that does not work |
| Server | An error, or an unreadable answer, from the tool |
| Other | Anything else |
Use the dashboards to cut alert noise
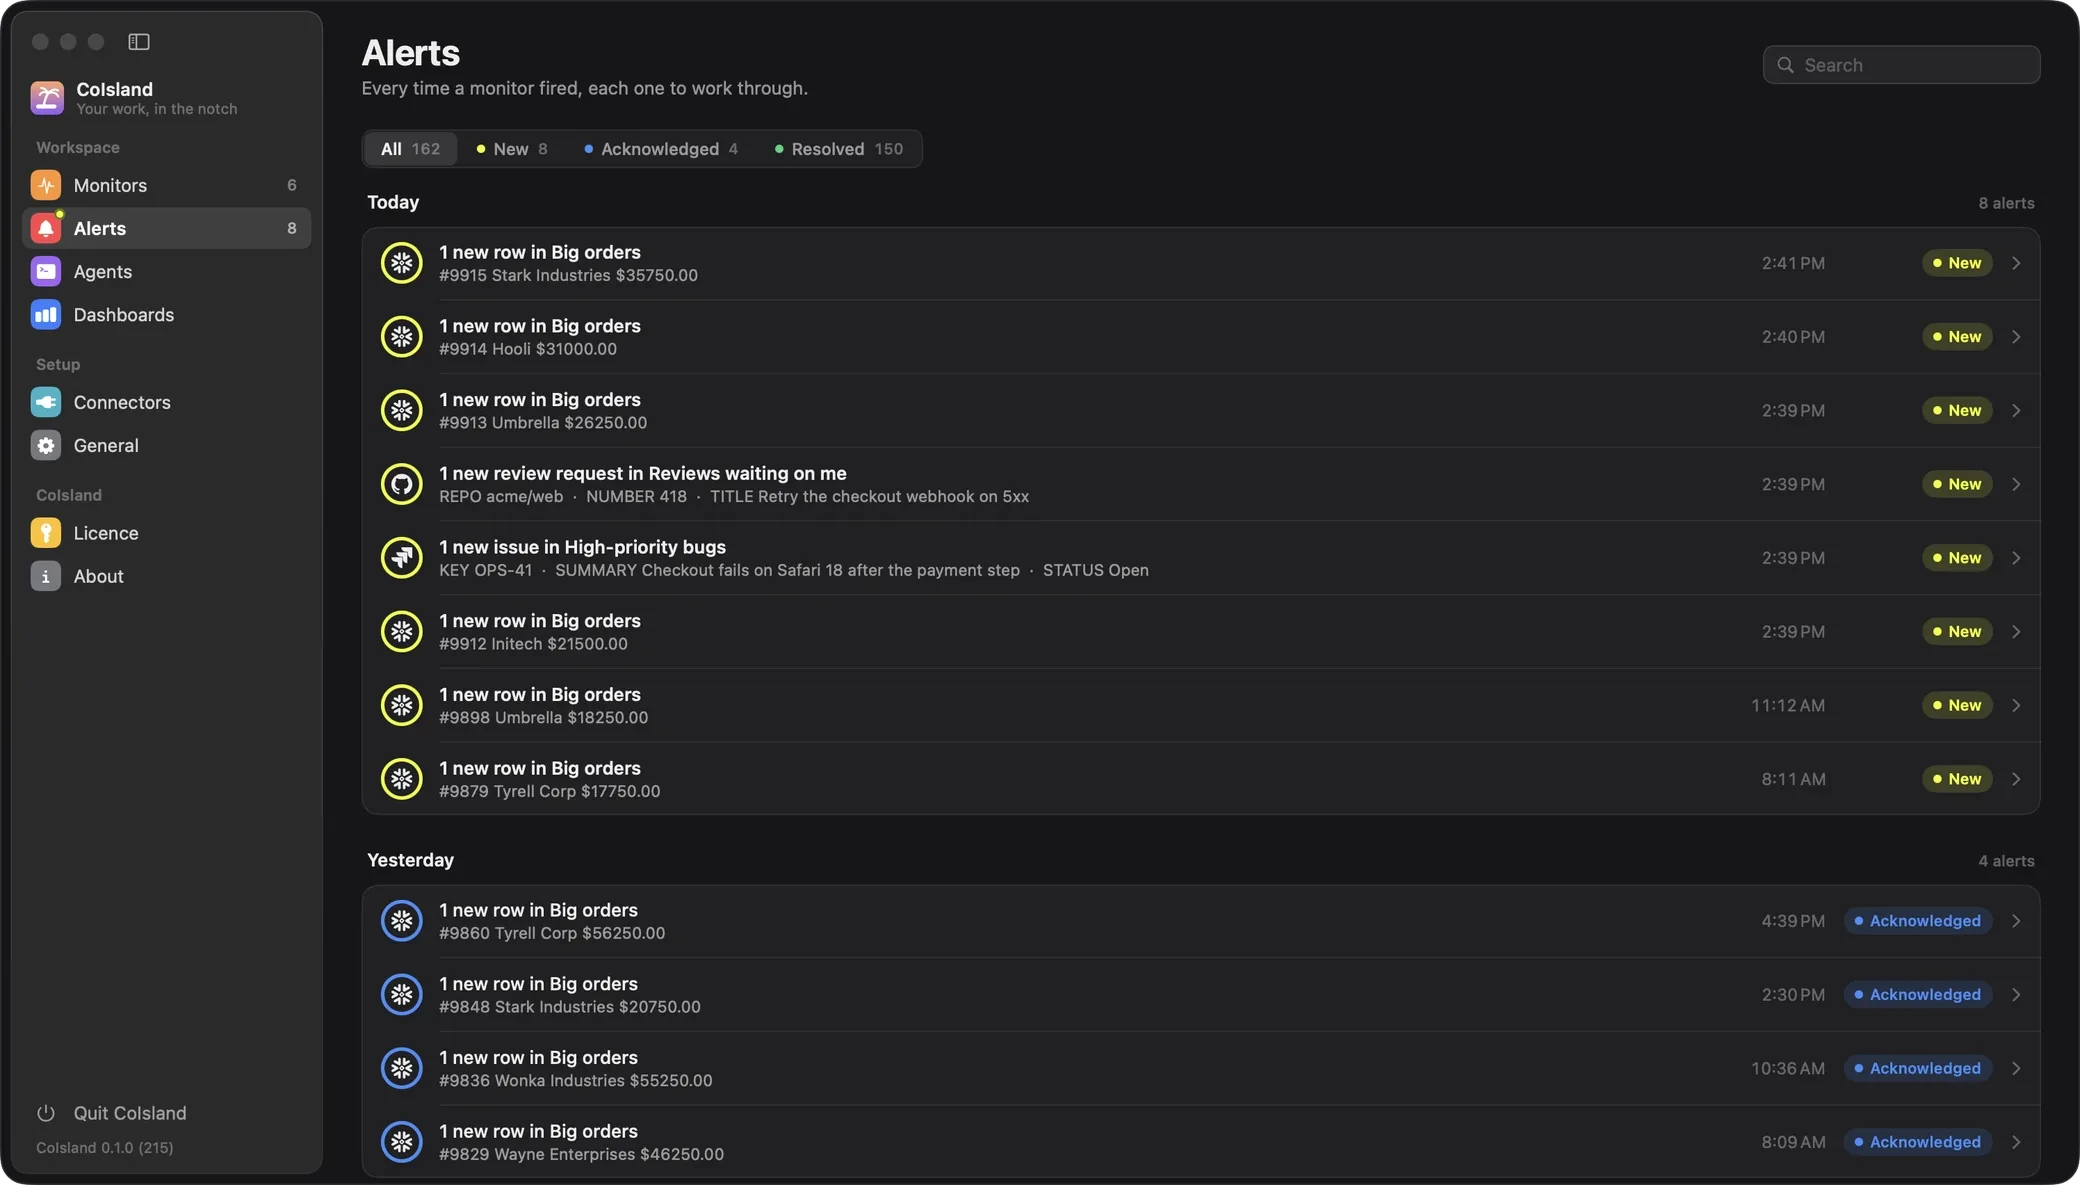
Start with Noisiest monitors and Actionability: a monitor that raises many alerts nobody handles teaches your team to ignore the island. Open it from the list.

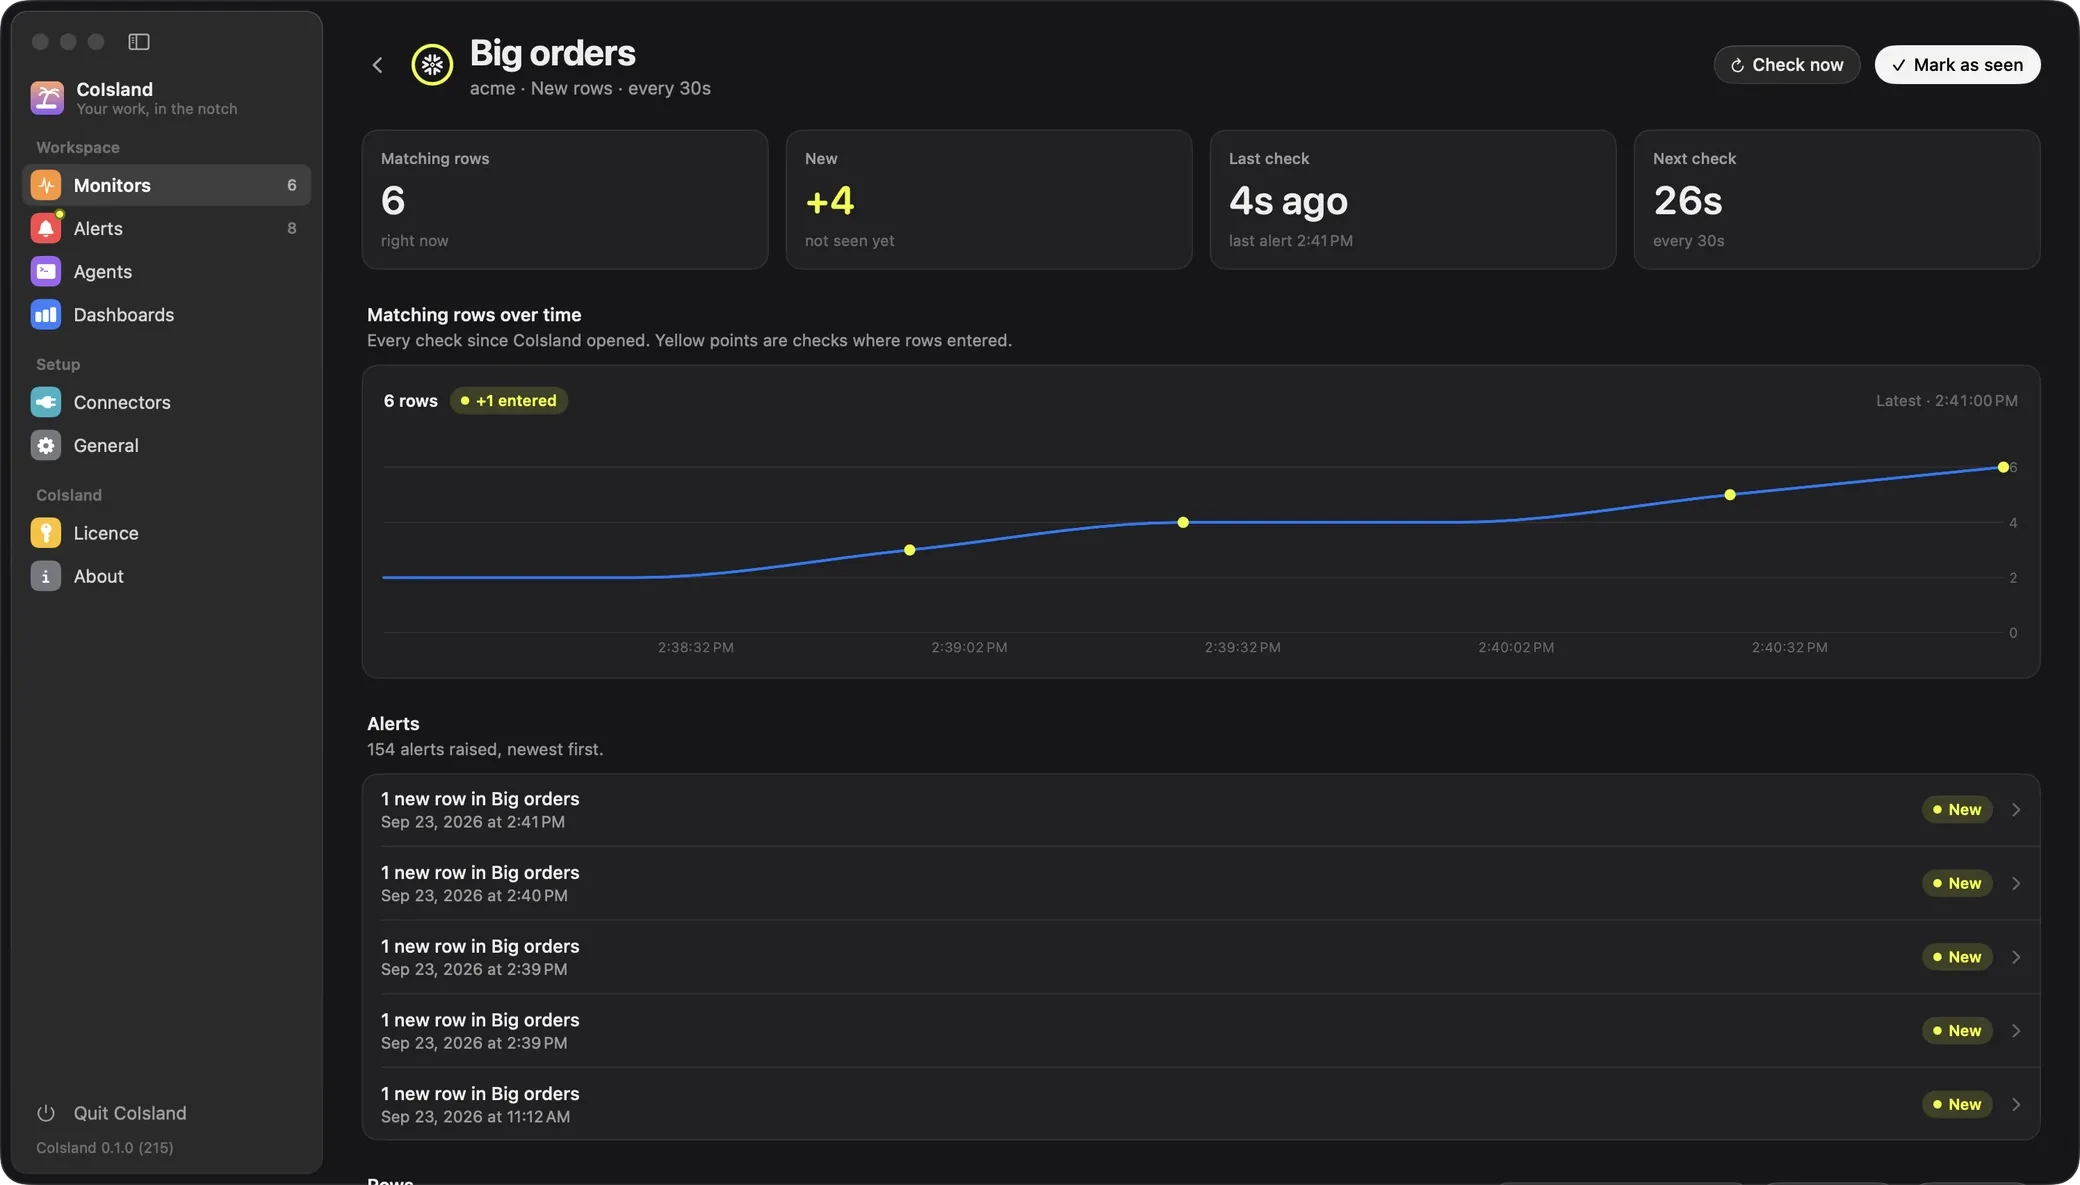
Lengthen the check interval
A New rows monitor alerts at every check that finds new rows. At every: 30s, nearly every big order is an alert of its own;
at every: 15m, the orders placed between two checks arrive together, as “3 new rows in Big orders”.
-- name: Big orders
-- every: 15m
-- key: ORDER_ID
-- alert: new-rows
SELECT order_id, customer, amount, created_at
FROM sales.orders
WHERE amount > 10000
Raise the threshold
A count rule fires once, when it becomes true. A noisy one keeps crossing its line: set the line above normal, here from count > 0 to count > 5.
-- name: Slow queries
-- every: 15m
-- database: ANALYTICS
-- alert: count > 5
SELECT query_id, user_name, warehouse_name,
  total_elapsed_time / 1000 AS seconds
FROM TABLE(INFORMATION_SCHEMA.QUERY_HISTORY(
  END_TIME_RANGE_START => DATEADD(hour, -1, CURRENT_TIMESTAMP()),
  RESULT_LIMIT => 10000))
WHERE total_elapsed_time > 300000
Narrow what it watches
A GitHub failed workflow runs monitor on repo:acme/api alerts on feature branches too.
Keep the branch that matters:
repo:acme/api branch:mainFix a failing monitor
For Authentication, give the connector a new token. For Query, fix the query and press Test, which runs it once without saving or alerting. Still not sure why a monitor fires? Hand an alert to an agent: it gets the whole alert, the query included, and tells you what it found. Snowflake monitors are also files, described in Watch files.
Where the numbers come from
Everything here is computed on your Mac, from your monitors, your alerts and a log of checks. CoIsland has no server and no account: nothing on this page leaves the Mac.
The check log is in ~/Library/Application Support/CoIsland/checks, one owner-only file per UTC day. Each line
holds a check’s monitor, connector, start, duration, outcome, counts and failure cause. Never a row, never an error message,
since Snowflake’s can quote your data:
{"connector":"acme","entered":1,"kind":"snowflake.custom-sql","matching":6,"ms":412,"outcome":"fired","provider":"snowflake","start":"2026-09-21T16:32:00Z","v":1,"watch":"big-orders.sql"}
{"error":"auth","kind":"github.workflow-runs","ms":233,"outcome":"failed","provider":"github","start":"2026-09-21T16:40:12Z","v":1,"watch":"ci-failures.sql"}
It keeps 62 days, so the 30-day view always has the 30 days before it. Alerts keep the newest 500. When the history does not cover the whole period, because of a limit or because logging started recently, a note above the tiles says so, as in the first screenshot.
Dashboard questions
How does CoIsland calculate mean time to acknowledge?
It shows the median time to acknowledge instead of the mean, with the 90th percentile beside it. The time runs from when an alert was detected to its first acknowledgement, or to its resolution when nobody acknowledged it first. One alert left open over a weekend throws off a mean, not a median.
What does actionability mean on the dashboards?
It is the share of the period’s alerts that someone acknowledged or resolved. When it falls, more alerts go untouched: a sign of alert fatigue, and of monitors worth tuning.
How long does CoIsland keep dashboard history?
The check log keeps 62 days, so the 30-day view can always compare with the 30 days before it. Alerts keep the newest 500. When either limit cuts into the period on screen, a note above the tiles says so.
Do the dashboards send my data anywhere?
No. They are computed on your Mac from files in your home folder. CoIsland has no server and no account, and its check log holds no rows and no error messages: only counts, times and the cause of each failure.
Can I see the dashboards for one connector only?
Yes. One menu narrows every figure to one tool, such as Snowflake or Jira, and the next to a single connector. The period buttons choose 24 hours, 7 days or 30 days.
Can I export the dashboard numbers?
There is no export button. Switch a chart to its table with the grid button and select the numbers to copy them. The check log itself is plain JSON, one line per check, in ~/Library/Application Support/CoIsland/checks.
Why is a monitor marked Failing or Degraded?
Failing means its last check failed. Degraded means its last check worked, but fewer than 95% of its checks in the period did. The Last error column gives the cause, such as Authentication or Query.
What happens to the history of a deleted monitor?
Its alerts and checks stay in the figures under its last name. Monitor health lists it as deleted while it has checks in the period.
Work with AI. Stay in control.
CoIsland Community is free, for good. Lifetime from $29, paid once. Native for Apple Silicon, macOS 14 and later.