Connectors for your work stack
A connector is one account on one tool you work with: its address and its secret. Your monitors run on it, read-only, straight from your Mac to the tool's own API.
Connectors available today
Each connector watches one part of your work stack, in that tool's own language. More are on the way.
-
Calendar & mail
Gmail
Hear about the emails that matter, not every email. Unread mail, chosen senders, labels, Drive comments and invitations reach your Mac's notch, and nothing is marked read.
-
Calendar & mail
Calendar
The calendars Calendar.app already shows (iCloud, Google, Exchange, subscriptions), or a calendar's secret ICS feed, in your Mac's notch. A countdown to your next meeting, a warning before it starts with one click to join, and news of invitations and changes.
-
Calendar & mail
Dock badges
One watch over every app that badges its Dock icon. Slack, Microsoft Teams, Outlook, Mail, Messages, Discord, WhatsApp or any other app tells the notch when its count goes up, with no account or token for any of them.
-
Calendar & mail
Apple Mail
Every account Mail already has, iCloud, Exchange, Gmail or any IMAP, in your Mac's notch. New unread mail in your inboxes, or only from the people and domains you pick, with no password given to CoIsland.
-
Code & deploys
GitHub
Monitor GitHub for what needs you, not everything that moves. Reviews, failed Actions runs, releases and security alerts, on github.com or GitHub Enterprise.
-
Code & deploys
Vercel
Watch Vercel deployments, stuck builds and project domains. A failed build reaches your Mac's notch with its error, and the alert shows the failing step and the end of the build log.
-
Code & deploys
GitLab
Watch GitLab on gitlab.com or a self-managed instance. A review request, a failed pipeline or a new to-do reaches your Mac's notch, and the alert shows the merge request with its description and comments, or the jobs that failed.
-
Code & deploys
Cloudflare
Watch Cloudflare Pages deployments, Worker errors and your zones. A failed build reaches your Mac's notch with its failing step, and the alert shows the end of the build log.
-
Code & deploys
Render
Watch the deploys of your Render services and whether they are suspended. A failed deploy reaches your Mac's notch with its commit, and a suspended service says who suspended it.
-
Issues & docs
Jira
Monitor Jira with the JQL you already write. New matches, status changes, comments, SLAs near a breach and sprint scope reach your Mac's notch, from Jira Cloud or Data Center.
-
Issues & docs
Linear
Monitor Linear with its own issue filters. New matches, status changes, issues in triage, SLAs at risk, your mentions and projects going off track reach your Mac's notch.
-
Issues & docs
Confluence
Monitor Confluence Cloud without the email digest. Mentions, page edits, new comments, your tasks and any CQL reach your Mac's notch, signed in with the same API token as Jira.
-
Issues & docs
Asana
Know what landed on your plate and what is late. Tasks assigned to you, due dates, new tasks in a project and comments on your tasks reach your Mac's notch, read with your own Asana token.
-
Issues & docs
ClickUp
Know what is yours and what is late. Tasks assigned to you, their status and due dates, and new tasks in a list reach your Mac's notch, read with your own ClickUp token.
-
Issues & docs
Todoist
Know what is due before it is late. Tasks due today or overdue, new tasks in a project, or any filter you already use reach your Mac's notch, read with your own Todoist token.
-
Issues & docs
Notion
Know when a Notion row lands on you, a page you care about changes, or someone comments. Read with your own personal access token, straight from your Mac.
-
Issues & docs
Shortcut
Know when a story lands on you, moves to review, or an iteration is about to end with work still open. Read with your own Shortcut API token.
-
Issues & docs
Airtable
Know when a record starts matching a formula, or someone edits one, without keeping the base open. Read with a personal access token scoped to the bases you pick.
-
Issues & docs
Reminders
The reminders Reminders.app already has, iCloud or Exchange, in your Mac's notch. A warning before one is due, another when it is overdue, and news when someone adds to a list you share.
-
Errors & on-call
Sentry
Monitor Sentry with the searches you already write. New errors, regressions, issues assigned to you, failing crons, sites down and new releases reach your Mac's notch, from sentry.io or your own Sentry.
-
Errors & on-call
PagerDuty
Know at a glance whether you have to move. Incidents assigned to you, your teams' incidents and your on-call shifts reach your Mac's notch, read with your own PagerDuty token.
-
Errors & on-call
Datadog
Know when a Datadog monitor fires without living in the dashboard. Monitors in alert, incidents and metric thresholds reach your Mac's notch, read with your own application key.
-
Errors & on-call
New Relic
Run the NRQL you already trust, and see New Relic's alert issues the moment they open, in your Mac's notch, with your own User key.
-
Errors & on-call
Langfuse
Your LLM app fails, overspends or gets a thumbs down, and the notch says so. Langfuse's errors, cost, latency and scores reach your Mac, read with a project's key pair on Langfuse Cloud or your own Langfuse.
-
Data
Snowflake
Monitor Snowflake with read-only SQL. A failed task, a row that breaks a rule or a sudden spike reaches your Mac's notch, and Cortex Code, Claude Code or Codex can take it from there.
-
Data
Databricks
Monitor Databricks from your Mac's notch. A failed job run, a failed pipeline update or a triggered SQL alert reaches you for free, and read-only SQL on a warehouse watches the data itself.
-
Data
dbt
Monitor dbt from your Mac's notch. A job run that fails, a run that takes too long or a source that goes stale reaches you, with the failing step's log one click away.
-
Data
PostHog
Monitor PostHog from your Mac's notch. A HogQL query that finds something, an insight crossing a number or an exception seen for the first time reaches you without opening a dashboard.
-
Data
Supabase
Monitor Supabase from your Mac's notch. A paused or unhealthy project, a new security lint or a row your SQL finds reaches you, with nothing but a personal access token.
-
Data
PostgreSQL
Monitor PostgreSQL from your Mac's notch. A read-only query checks your database on a schedule, and each new row it finds reaches you once.
-
Data
MySQL
Monitor MySQL and MariaDB from your Mac's notch. A read-only query checks your database on a schedule, and each new row it finds reaches you once.
-
Data
ClickHouse
Monitor ClickHouse from your Mac's notch. A read-only query, or a health check on the system tables, runs on a schedule, and each new problem reaches you once.
-
Web & scripts
HTTP / JSON
Point CoIsland at any address. A JSON value that changes or crosses a threshold, a new element of a JSON list, or a page that goes down or starts saying "In stock" reaches your Mac's notch.
-
Web & scripts
RSS / Atom
Watch any feed. A new GitHub release, a new post on a blog, or a Hacker News story that says your keyword reaches your Mac's notch, with the article one click away.
-
Web & scripts
Status pages
Know when a service you depend on is down before your users tell you. Incidents, their updates, components going down and the page's overall status reach your Mac's notch.
-
Web & scripts
Shell command
Run a command or a script on your Mac on a schedule. A new line it prints, a new object in its JSON, or a failure reaches the notch once.
-
Business
Stripe
Watch failed payments, disputes, subscriptions, payouts and your balance with a read-only restricted key. A declined card reaches your Mac's notch with the amount, the customer and the bank's reason.
What each connector watches
Grouped by kind of tool. Each line below is a monitor you can add in Settings › Monitors.
Calendar & mail
Your meetings, your inbox and the unread counts on your Dock. A monitor counts down to the next meeting, finds new mail without marking it read, or watches a badge climb.
Gmail
4 monitor kinds · Setup guide
- Unread mail New unread emails in your inbox, or wherever a Gmail search says.
- Mail from people Unread emails from the addresses or domains you pick.
- Gmail search Any Gmail search. A label, starred mail, Drive comments, calendar invitations, missed chats.
- Unread count Alerts when a pile of emails crosses the number you set.
Calendar
2 monitor kinds · Setup guide
- Meetings Counts down to your next meeting and warns a few minutes before it starts, once.
- Invitations and changes An event added, moved or cancelled in the days ahead, or an invitation still to answer.
Dock badges
2 monitor kinds · Setup guide
- New unread An app's Dock badge goes up. A count going down stays quiet.
- Badge over a threshold An app's badge passes the number you pick, or any badge at all.
Apple Mail
2 monitor kinds · Setup guide
- Unread mail New unread messages in every inbox, or in the mailboxes you pick.
- Mail from people Unread messages from the addresses or domains you pick.
Code & deploys
Your repositories, your builds and what ships from them. A monitor is a search or a pick of projects, and each check looks for what is new or failed since the last.
GitHub
5 monitor kinds · Setup guide
- Issues and pull requests Any GitHub search, as you type it on github.com. Each new match alerts once.
- Review requests Pull requests waiting on you or on your team.
- Failed workflow runs GitHub Actions runs that fail, by repository, branch, workflow, event or actor.
- New releases Releases your repositories publish. Drafts never count.
- Security alerts Open Dependabot, code scanning and secret scanning alerts, by severity.
Vercel
3 monitor kinds · Setup guide
- Deployments A deployment fails, goes live, is canceled or blocked, on the projects and branches you pick.
- Stuck builds A deployment queued or building for longer than you allow.
- Domain problems A domain not pointing at Vercel, not verified, or with a certificate about to expire.
GitLab
5 monitor kinds · Setup guide
- Review requests Open merge requests waiting for your review, across every project or the ones you name.
- Merge requests and issues Assigned to you, yours, or a project's, in the state you pick.
- Failed pipelines A pipeline of your projects fails, on the branch or source you pick.
- New releases A project publishes a release, or a new tag.
- To-do items What GitLab asks you to act on, such as a review requested or a mention.
Cloudflare
3 monitor kinds · Setup guide
- Failed Pages deployments A Pages deployment of the projects you pick fails to build or deploy.
- Worker errors A Worker throws errors, or at least the number you set, within a window.
- Zone problems A zone paused, still waiting for its nameservers, moved away or deactivated.
Render
2 monitor kinds · Setup guide
- Failed deploys A deploy of the services you pick fails to build, to start, or in its pre-deploy command.
- Suspended services A service is suspended, by a person, for billing or for crash looping.
Issues & docs
Your issues, tasks, reminders and pages. A monitor is a search in the tool's own query language or a few fields, and an item alerts when it starts matching or comes due.
Jira
5 monitor kinds · Setup guide
- Issues Any JQL. An issue alerts when it starts matching.
- Status changes An issue alerts each time it lands in a new status.
- Comments Each new comment on the issues your JQL finds.
- SLAs Service requests that breached, or soon will, with breached() and remaining().
- Sprint scope Issues that join an open sprint, and which sprint.
Linear
6 monitor kinds · Setup guide
- Issues Any Linear issue filter. An issue alerts when it starts matching.
- Status changes An issue alerts each time it lands in a new workflow state.
- New in triage Issues entering a team's Triage, with who asked.
- SLA at risk Issues turning high risk, then breached (Business and Enterprise).
- Inbox Your mentions, replies and assignments, by category.
- Project health Project updates posted at risk or off track.
Confluence
5 monitor kinds · Setup guide
- Search (CQL) Any CQL. A page, blog post or comment alerts when it starts matching.
- Mentions Someone @-mentioned you on a page, blog post or comment.
- Page updates Each new version of the pages you follow, with what changed.
- Comments New footer and inline comments on the pages you pick.
- Tasks Inline tasks assigned to you, and the day they are overdue.
Asana
4 monitor kinds · Setup guide
- Assigned to me A task alerts when it is assigned to you, in the workspace and projects you pick.
- Due and overdue Your tasks overdue or due today, tomorrow or within days. A task alerts again when its due date moves.
- New tasks in a project A task added to a project you pick, by anyone.
- Comments on my tasks Someone else comments on one of your tasks, or only when they @-mention you.
ClickUp
3 monitor kinds · Setup guide
- Assigned to me A task alerts when it is assigned to you, or when one of yours enters a status you pick.
- Due and overdue Your tasks overdue or due today, tomorrow or within days. A task alerts again when its due date moves.
- New tasks in a list A task created in a list you pick, by anyone.
Todoist
3 monitor kinds · Setup guide
- Due and overdue Your tasks overdue or due today or within days, by project, label and priority. A recurring task alerts again on its next day.
- Filter Any Todoist filter, like today | overdue, assigned to: me or #Work & p1.
- New tasks in a project A task added to a project you pick, by you or a collaborator.
Notion
3 monitor kinds · Setup guide
- Database rows A row alerts when it starts matching Notion's own filter, or lands in a people property that holds you.
- Edited pages Pages of a database edited in the last hour, day or week, optionally not by you. Each edit alerts.
- Comments New open comments on up to ten pages you pick, optionally leaving out your own.
Shortcut
3 monitor kinds · Setup guide
- Stories Any Shortcut search. A story alerts when it starts matching; owner:me is you.
- Entered a state A story moves into the workflow state you pick, and again each time it comes back.
- Iteration ending A started iteration ends within the days you pick, with its open stories.
Airtable
2 monitor kinds · Setup guide
- Records Records of a table or view that a formula keeps. A record alerts when it starts matching.
- Changed records Records edited in the last hour, day or week. Each edit to a field alerts; formulas recomputing do not.
Reminders
2 monitor kinds · Setup guide
- Due soon and overdue Counts down to the next reminder due, warns before it, and again once it is overdue.
- New reminders A reminder added to a list you pick, such as one shared with your family or team.
Errors & on-call
Your errors, your alerts and your on-call shifts. A monitor is a search, a query or a pick of services, and each check says what burns and who has it.
Sentry
5 monitor kinds · Setup guide
- Issue search Any Sentry search. An issue alerts when it starts matching.
- Regressed & escalating Issues that came back after being resolved, or are getting worse.
- Assigned to me Issues assigned to you, or suggested for you by ownership rules.
- Crons, uptime & metric A cron that fails or is missed, a site down, a metric monitor that trips.
- New releases Each new release of your projects, and the new issues it brought.
PagerDuty
6 monitor kinds · Setup guide
- Assigned to me An incident alerts when it is assigned to you, and again when it comes back to you.
- Incidents Open incidents on the services or teams you pick, by status and urgency.
- Status changes Triggered, acknowledged, resolved. Each move alerts once.
- Acknowledged too long An acknowledged incident nobody resolved, past the time you set.
- On call now Your shift starts, or ends, and the notch says until when.
- Shift starting soon A heads-up before you go on call.
Datadog
3 monitor kinds · Setup guide
- Monitors alerting A monitor goes to Alert or Warn, narrowed by tags. Warn to Alert alerts again.
- Incidents An incident is declared, or raised to a higher severity.
- Metric threshold A metric query crosses a number, each host on its own.
New Relic
2 monitor kinds · Setup guide
- NRQL query Any NRQL; a new row, or a row count crossing a threshold, alerts.
- Open issues Critical and high issues as New Relic opens them; a raised priority alerts again.
Langfuse
5 monitor kinds · Setup guide
- LLM errors A generation, span or tool call logged with level ERROR, narrowed by model, name, trace or environment.
- Cost over a limit What the project, or each model or trace, cost today or over the last hours goes above a number of dollars.
- Slow LLM calls The p95 latency of generations over a window goes above a number of seconds.
- Eval score below a limit A numeric score from an evaluator, the API or an annotation comes in under a number.
- Negative user feedback A user's feedback score comes in at a value you call negative, with their comment.
Data
Your warehouses, databases and product analytics. A monitor is a query, and each check compares the rows it returns with the last ones.
Snowflake
2 monitor kinds · Setup guide
- Custom SQL Any SELECT, WITH or SHOW query. Alert on new rows, or when the row count crosses a number.
- Validation A table, a column and a rule such as is null. CoIsland writes the SQL and shows it.
Databricks
5 monitor kinds · Setup guide
- Custom SQL Any SELECT, WITH or SHOW on a SQL warehouse. Alert on new rows, or when the row count crosses a number.
- Validation A table, a column and a rule such as is null. CoIsland writes the SQL and shows it.
- Failed job runs A job run that failed or timed out, with the failed task's error. Wakes no warehouse.
- Failed pipeline updates A pipeline update that failed, with its error events. Wakes no warehouse.
- Triggered SQL alerts A Databricks SQL alert entering TRIGGERED, once, and again after it is back to OK.
dbt
3 monitor kinds · Setup guide
- Failed job runs A run that ended in error, or cancelled when you ask, with the failed step's last log lines.
- Long runs A run that has been running, or ran, longer than the time you set.
- Source freshness A source stale in its job's latest freshness check: error, warn or runtime error.
PostHog
3 monitor kinds · Setup guide
- HogQL query Any HogQL SELECT on events, persons or sessions. Alert on new rows, or when the row count crosses a number.
- Insight threshold A saved Trends insight goes above or below a number: once as it crosses, and again after it came back.
- New exceptions An error tracking issue seen for the first time, with its events, users and last stack.
Supabase
3 monitor kinds · Setup guide
- Read-only SQL Any SQL, run as the project's read-only role. Alert on new rows, or when the row count crosses a number.
- Project health The project paused, restoring or failed, or a service (database, auth, Data API, realtime, storage) unhealthy.
- Advisor lints A new lint from the security or performance advisor, such as RLS disabled on a public table.
PostgreSQL
2 monitor kinds · Setup guide
- Custom SQL Any SELECT, WITH or SHOW, in a read-only transaction. Alert on new rows, or when the row count crosses a number.
- Validation A table, a column and a rule such as is null. CoIsland writes the SQL and shows it.
MySQL
2 monitor kinds · Setup guide
- Custom SQL Any SELECT, WITH or SHOW, in a read-only transaction. Alert on new rows, or when the row count crosses a number.
- Validation A table, a column and a rule such as is null. CoIsland writes the SQL and shows it.
ClickHouse
8 monitor kinds · Setup guide
- Custom SQL Any SELECT, WITH or SHOW, sent with readonly=1. Alert on new rows, or when the row count crosses a number.
- Validation A table, a column and a rule such as is null. CoIsland writes the SQL and shows it.
- Failed queries Each query that fails, from system.query_log: who ran it, the error and the SQL. Every replica with a cluster.
- Long-running queries A query still running past a time, from system.processes.
- Stuck mutations An ALTER UPDATE or DELETE not done after a time, and why it keeps failing.
- Too many parts A partition with more active parts than a number, before inserts slow down or fail.
- Replication lag A replica behind by more than a time, from system.replicas.
- Low disk space A disk with less free space than a share, from system.disks.
Web & scripts
Anything with an address or a command: a JSON API, a web page, a feed, a status page, a script on your Mac. A monitor names what to read, and says what in it counts.
HTTP / JSON
3 monitor kinds · Setup guide
- JSON value A value at a path like $.status changes, or goes above, below, to or away from what you give.
- New JSON items A new element of a JSON list, named by the field you pick (id unless you say).
- Web page A page answers a failing status, or starts or stops saying a phrase.
RSS / Atom
2 monitor kinds · Setup guide
- New entries A feed publishes an entry it did not have before.
- Keywords Only entries saying one of your words in their title, text or categories.
Status pages
3 monitor kinds · Setup guide
- Incidents A service opens an incident, or posts an update to one, at the impact you pick.
- Component status A component you pick goes degraded, into an outage, or under maintenance.
- Overall status The page leaves All Systems Operational, at the level you pick.
Shell command
3 monitor kinds · Setup guide
- Output lines Each line the command prints that was not there at the previous check.
- JSON rows A script prints a JSON array; each new object is an alert, its keys as columns.
- Command fails An alert when the command exits with a non-zero status, once until it passes again.
Business
What pays for it all: your payments, subscriptions and payouts. A monitor picks what matters, and each check says what is new.
Stripe
5 monitor kinds · Setup guide
- Failed payments A charge is declined or fails, with the decline reason the bank gave.
- New disputes A customer disputes a payment, with the date to respond by.
- Subscriptions A subscription starts, or is canceled now or at the end of its period.
- Failed payouts A payout to your bank fails, with Stripe's reason.
- Low balance The available balance of a currency drops below the amount you set.
What a connector is
A connector is one account on one tool: its address, such as a Snowflake account, a GitHub host or a Jira site, and its secret, the token that signs in. Monitors run on connectors, and alerts, dashboards and agents work the same whichever tool answered.
Several connectors per tool, one default
Add as many as you need: a production and a staging Snowflake account, github.com next to a GitHub Enterprise Server, two Jira
sites. Each tool has one default: the first connector you add, or on Snowflake the Snowflake CLI's own default,
default_connection_name, when CoIsland imports your connections.
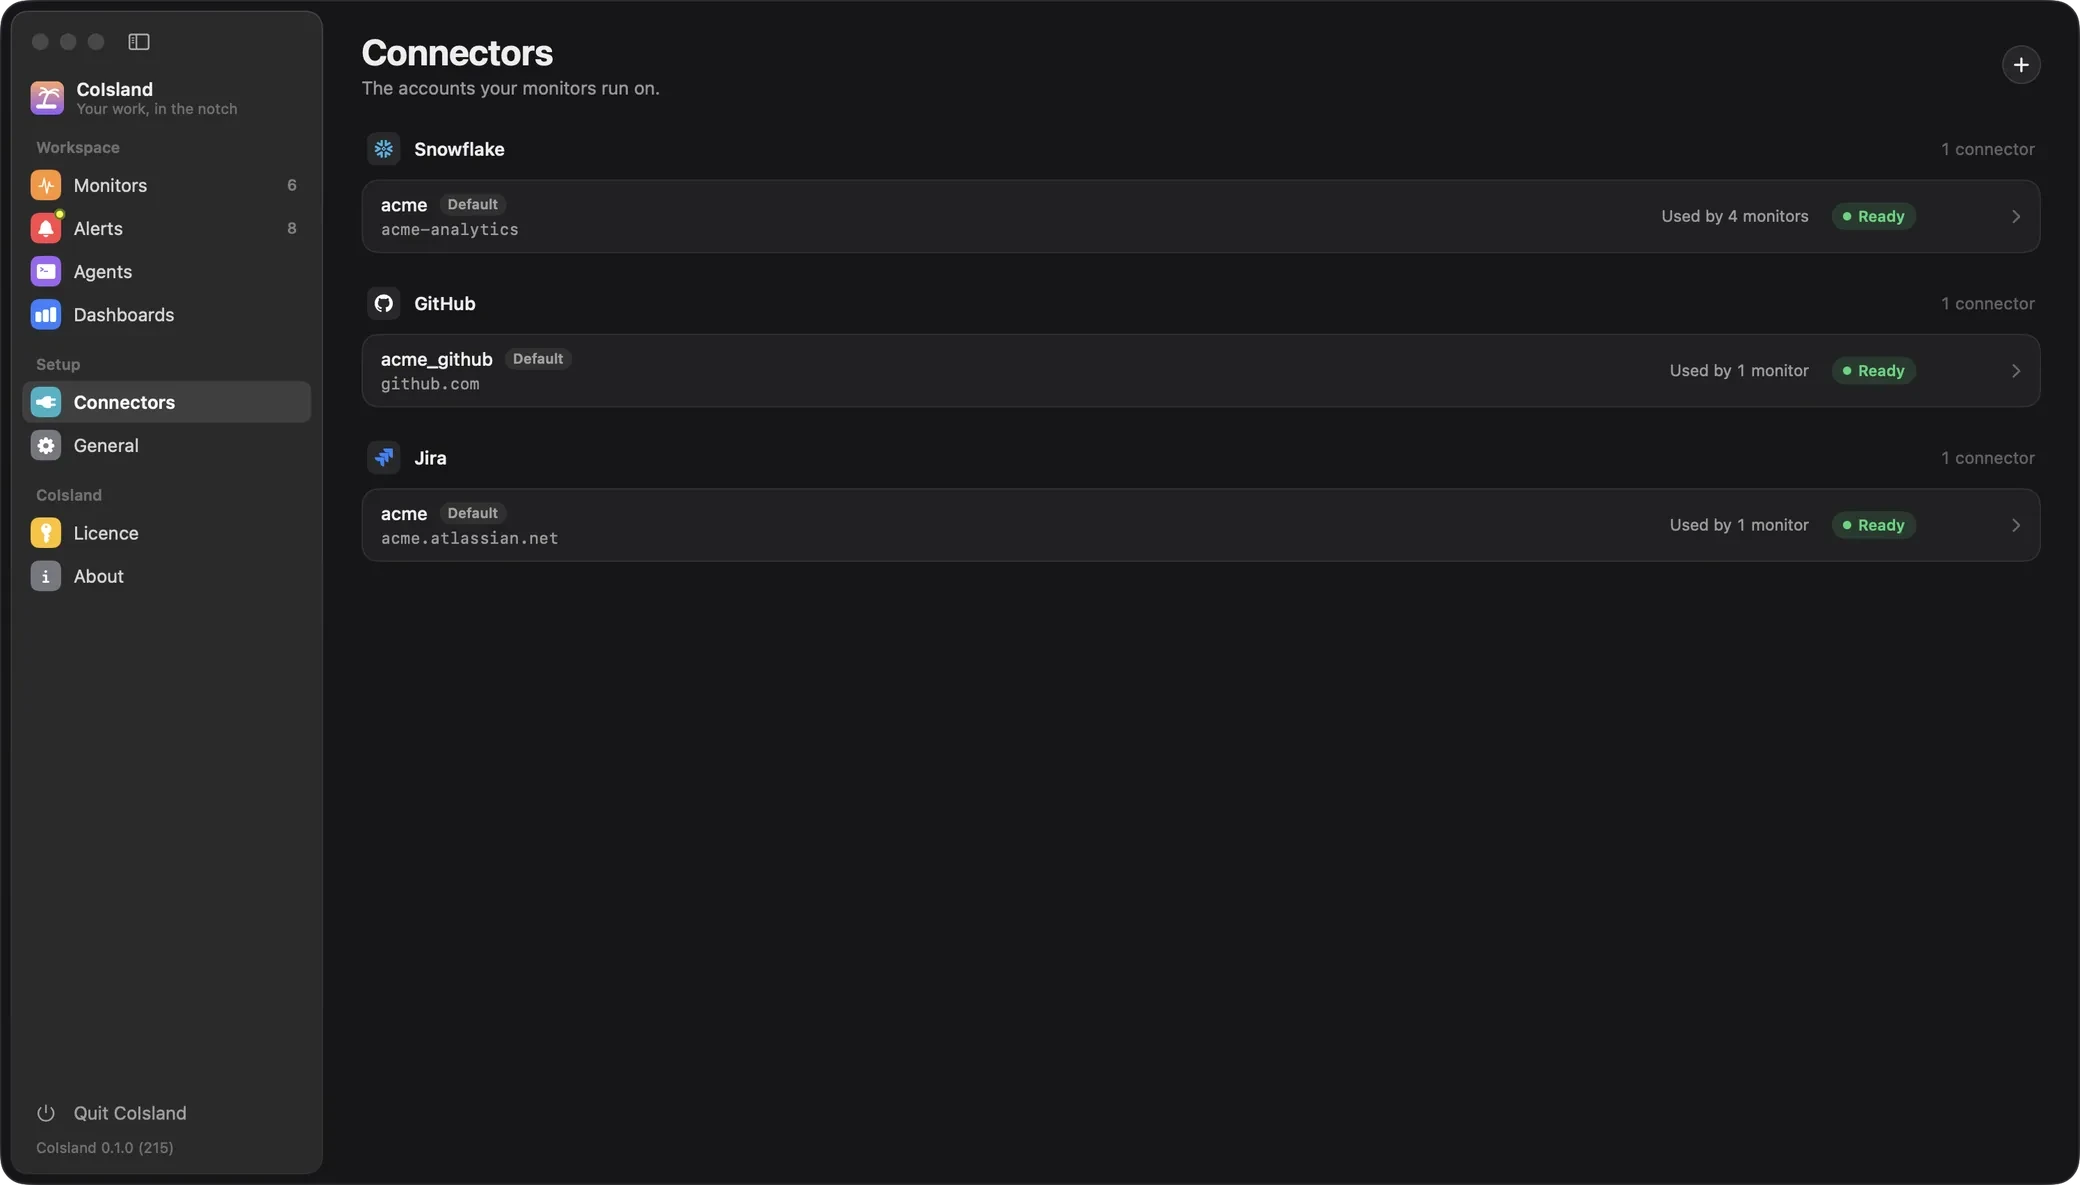
How a monitor picks its connector
A monitor's kind picks the tool, and its connector picks the account, or the tool's default when it names none. The editor's Connector
menu lists only that tool's connectors, so a name only has to be unique within its tool: above, Snowflake and Jira both have
an acme.
-- name: Breached requests
-- kind: jira.sla
-- connector: acme
-- every: 5m
-- alert: new-rows
-- sound: Glass

project = HELP AND "Time to resolution" = breached()
Every monitor is a .sql file like this one in ~/.coisland/watches, whatever its tool. See
the watch files docs for every key and monitors for the alert rules.
Read-only access, direct API calls, secrets on your Mac
CoIsland calls each tool's own API straight from your Mac. There is no CoIsland server and no CoIsland account, so your data and tokens pass through no one else, as the privacy policy says.
-
Snowflake
- Where it is kept
- CoIsland's owner-only file, the token in your login Keychain; never in ~/.snowflake
- What it can do
- SELECT, WITH or SHOW; anything else is refused before it is sent
-
GitHub
- Where it is kept
- The same file, the token in your login Keychain
- What it can do
- GET requests only, with a fine-grained read-only token
-
Jira
- Where it is kept
- The same file, the token in your login Keychain
- What it can do
- JQL searches only
-
Vercel
- Where it is kept
- The same file, the token in your login Keychain
- What it can do
- GET requests only; a Vercel token itself cannot be read-only
-
Linear
- Where it is kept
- The same file, the key in your login Keychain
- What it can do
- GraphQL queries only, with a Read key
-
Sentry
- Where it is kept
- The same file, the personal token in your login Keychain
- What it can do
- GET requests only, with Read scopes; it never resolves, assigns or mutes
-
PagerDuty
- Where it is kept
- The same file, the token in your login Keychain
- What it can do
- GET requests only; it never acknowledges or resolves
-
Gmail
- Where it is kept
- The same file, the app password in your login Keychain
- What it can do
- Read-only IMAP: searches and headers, never marking an email read
-
Confluence
- Where it is kept
- The same file, the token in your login Keychain
- What it can do
- CQL searches and reads only
-
Calendar
- Where it is kept
- The same file, with no secret for this Mac: macOS asks for calendar access once; a feed address in your login Keychain
- What it can do
- Read events on this Mac or a feed, never write them
-
Databricks
- Where it is kept
- The same file, the token in your login Keychain
- What it can do
- SELECT, WITH or SHOW on a warehouse, and reads of jobs, pipelines and alerts
-
Stripe
- Where it is kept
- The same file, the restricted key in your login Keychain
- What it can do
- GET requests only, with a restricted key whose permissions are Read; a secret key is refused
-
GitLab
- Where it is kept
- The same file, the token in your login Keychain
- What it can do
- GET requests only, with a read_api token
-
Asana
- Where it is kept
- The same file, the token in your login Keychain
- What it can do
- GET requests only; it never completes, edits or comments
-
ClickUp
- Where it is kept
- The same file, the token in your login Keychain
- What it can do
- GET requests only; it never changes a task or its status
-
Todoist
- Where it is kept
- The same file, the token in your login Keychain
- What it can do
- GET requests only; it never completes or edits a task
-
Cloudflare
- Where it is kept
- The same file, the token in your login Keychain
- What it can do
- GET requests and GraphQL analytics queries only, with a token of Read permissions
-
Render
- Where it is kept
- The same file, the key in your login Keychain
- What it can do
- GET requests only; a Render key itself cannot be read-only
-
dbt
- Where it is kept
- The same file, the token in your login Keychain
- What it can do
- GET requests only: runs, jobs and artifacts
-
PostHog
- Where it is kept
- The same file, the key in your login Keychain
- What it can do
- HogQL SELECT or WITH, and reads of insights and error tracking
-
Supabase
- Where it is kept
- The same file, the token in your login Keychain
- What it can do
- SQL as the read-only role, and reads of health and advisors
-
Datadog
- Where it is kept
- The same file, both keys in your login Keychain
- What it can do
- GET requests only; it never mutes, resolves or edits
-
New Relic
- Where it is kept
- The same file, the User key in your login Keychain
- What it can do
- NerdGraph queries only: NRQL and alert issues
-
Notion
- Where it is kept
- The same file, the token in your login Keychain
- What it can do
- Reads and searches only; it never edits a page
-
Shortcut
- Where it is kept
- The same file, the token in your login Keychain
- What it can do
- GET requests only; it never moves or edits a story
-
Airtable
- Where it is kept
- The same file, the token in your login Keychain
- What it can do
- GET requests only, with a token scoped to read records and schemas
-
Langfuse
- Where it is kept
- The same file with the public key, the secret key in your login Keychain
- What it can do
- GET requests only; the key pair itself could also write traces
-
HTTP / JSON
- Where it is kept
- The same file; an optional key in your login Keychain, sent only to its site
- What it can do
- GET requests only, 5 MB at most, https (http only on localhost)
-
RSS / Atom
- Where it is kept
- The same file; a private feed's password in your login Keychain, sent only to its site
- What it can do
- GET requests only, asked again only when the feed changed
-
Status pages
- Where it is kept
- The same file, with no secret: status pages are public
- What it can do
- GET of the page's public summary only
-
Dock badges
- Where it is kept
- The same file, with no secret: macOS asks for Accessibility once
- What it can do
- Read the badges on Dock icons, never the apps behind them
-
Reminders
- Where it is kept
- The same file, with no secret: macOS asks for Reminders access once
- What it can do
- Read reminders on this Mac, never complete or change them
-
Apple Mail
- Where it is kept
- The same file, with no secret: macOS asks to let CoIsland control Mail once
- What it can do
- Read unread messages while Mail is open, never marking one read
-
PostgreSQL
- Where it is kept
- The same file, the password in your login Keychain
- What it can do
- One SELECT, WITH or SHOW at a time, in a read-only transaction that is rolled back
-
MySQL
- Where it is kept
- The same file, the password in your login Keychain
- What it can do
- One SELECT, WITH or SHOW at a time, in a read-only transaction that is rolled back
-
ClickHouse
- Where it is kept
- The same file, the password in your login Keychain
- What it can do
- One SELECT, WITH or SHOW at a time, sent with readonly=1, and reads of the system tables
-
Shell command
- Where it is kept
- The same file, with no secret
- What it can do
- Run the command you wrote, as you, on this Mac; no shell reads it
Listing connectors never reads a secret, and a token only travels over https.
Add a connector in three steps
-
Open Settings › Connectors, click +, and pick the tool.
-
Fill in its form: the address, the token, and the name monitors will call it by.
-
Click Test connector to sign in, then Add Connector.
The + button opens the same picker that starts a new monitor, one card per tool.
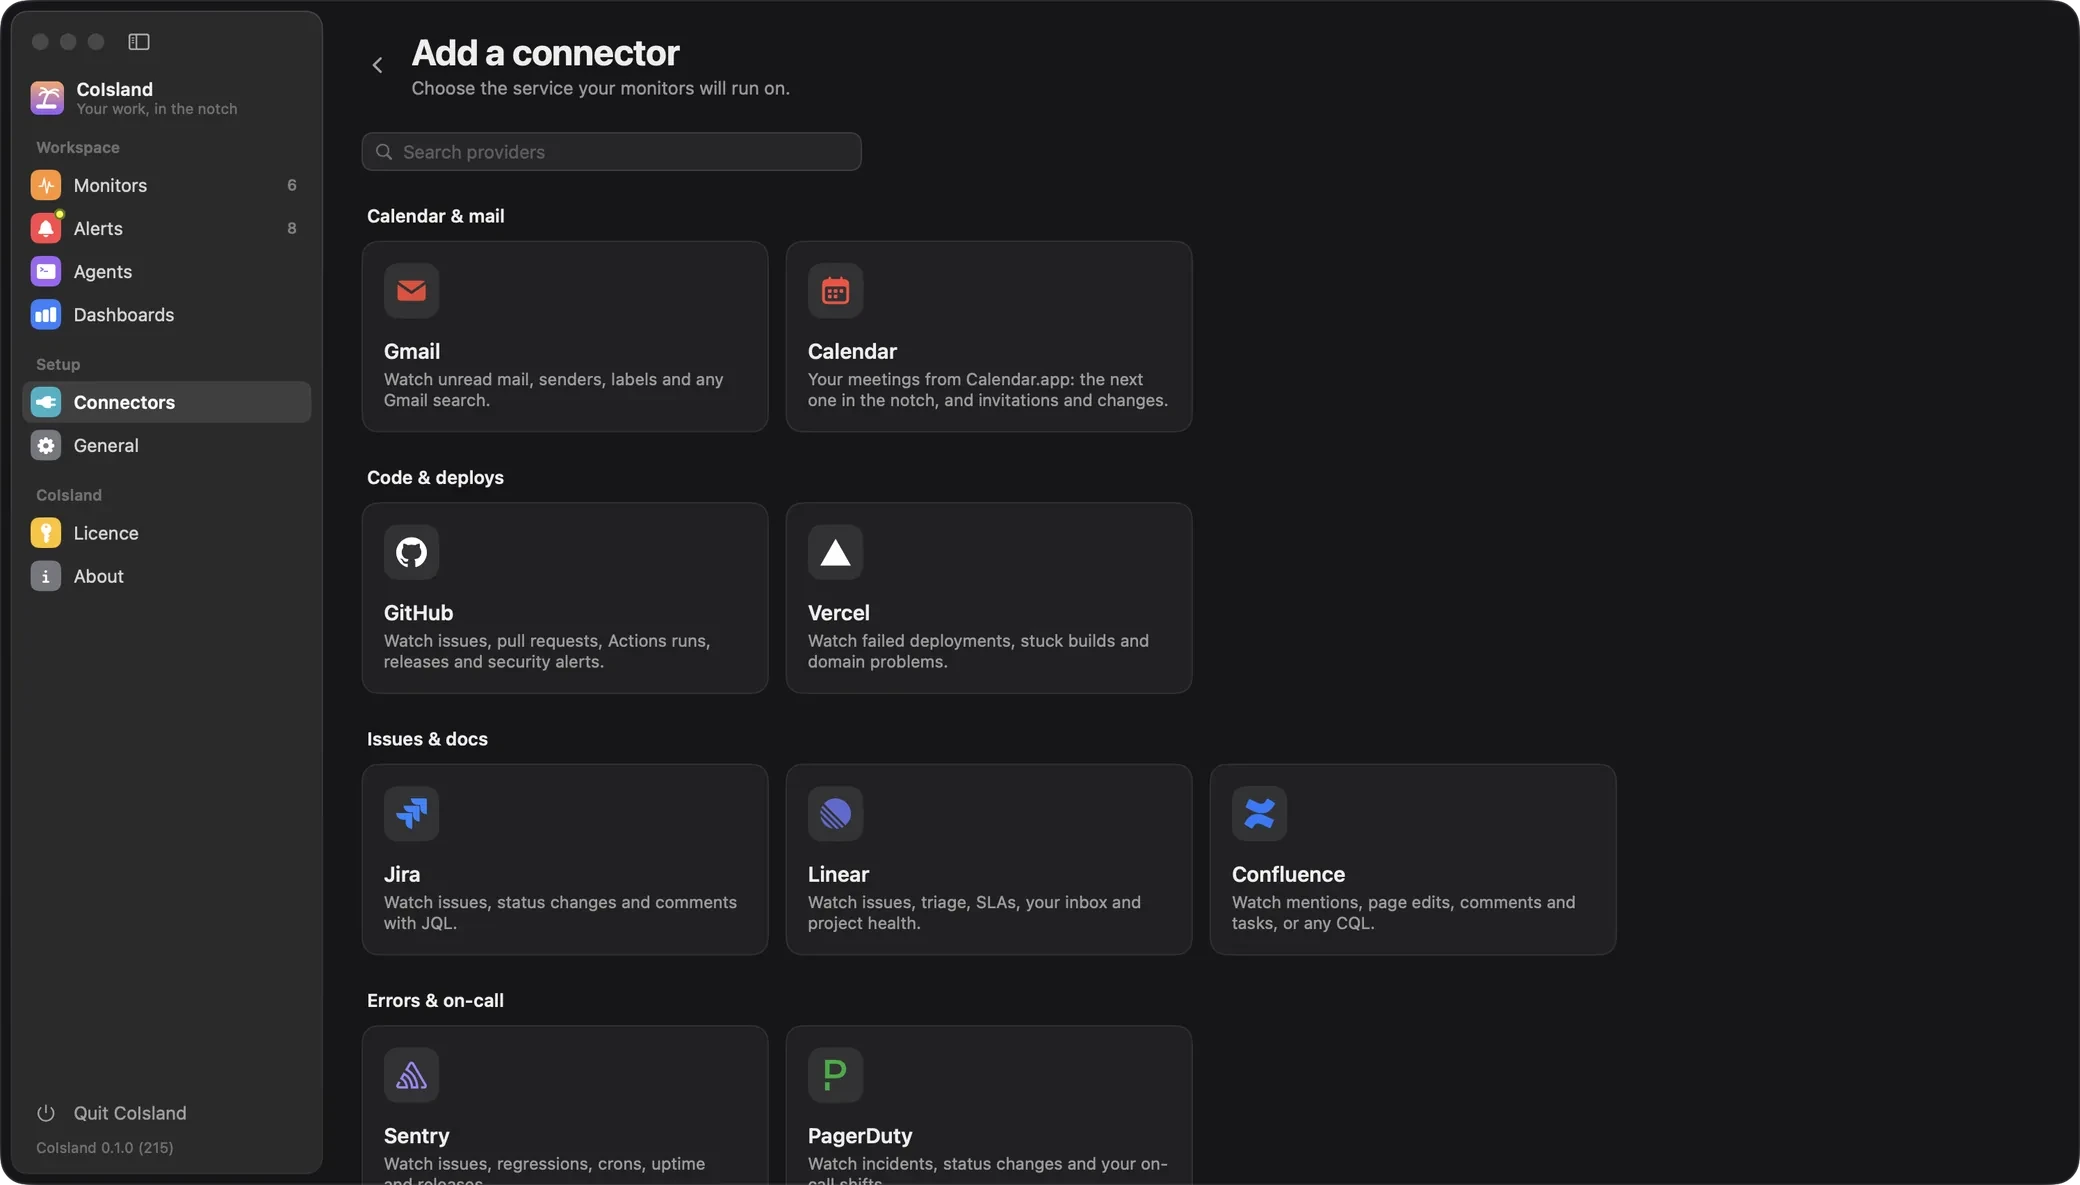
Each form asks only what its tool needs. Test connector signs in and says who it is (such as your user and role on Snowflake, your login on GitHub, your name and edition on Jira) and saves nothing.
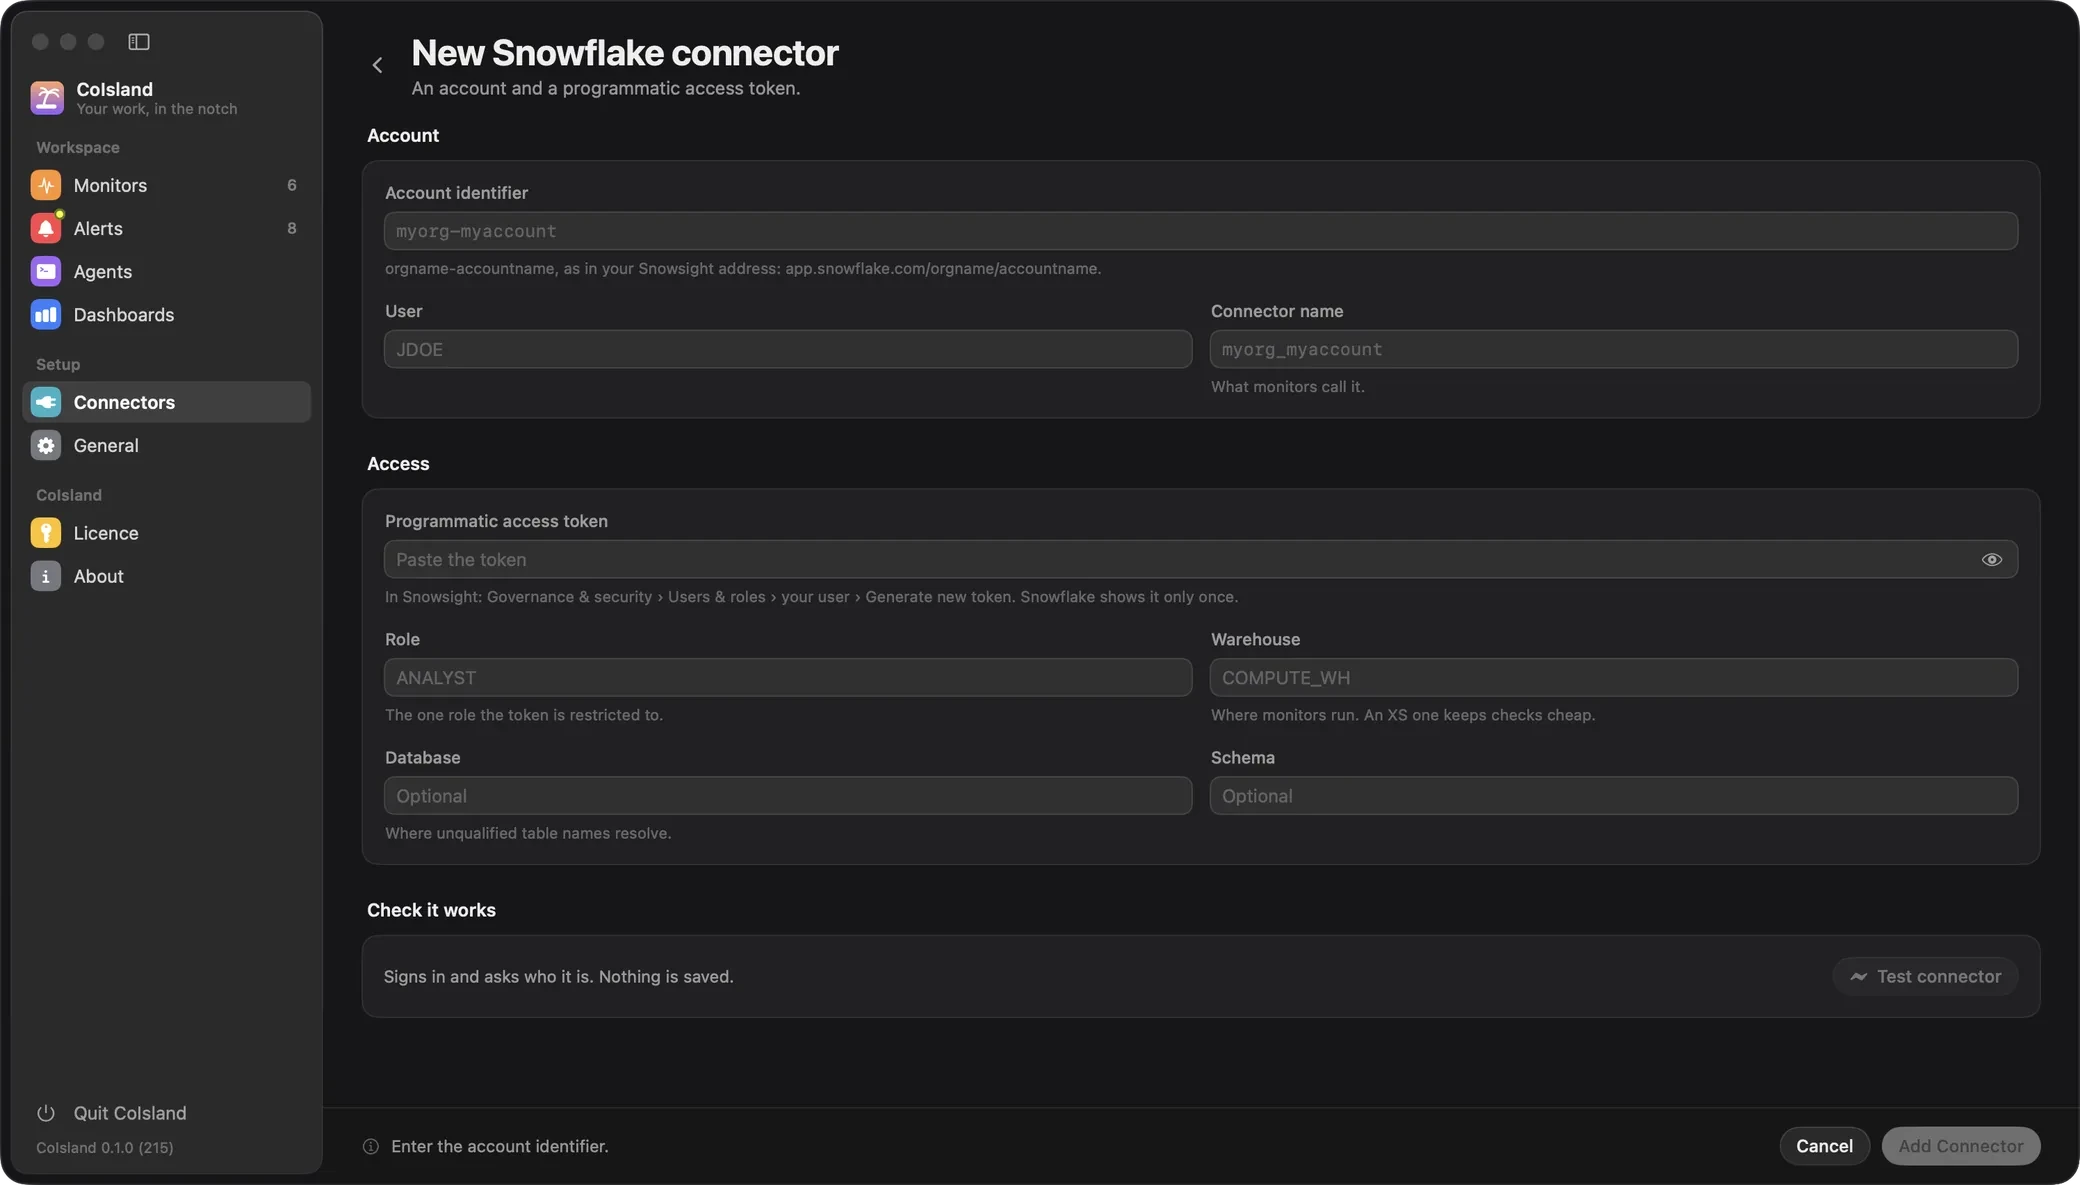
Already use the Snowflake CLI or Cortex Code?
CoIsland reads the same connections.toml in ~/.snowflake that they do, and never writes to it. The first
time it starts, it imports every connection that signs in with a programmatic access token, under the same name; later,
Import from Snowflake CLI fills the Snowflake form from one. Single sign-on and key-pair ones are not imported.
Step by step, with the permissions each token needs: connect Gmail , connect Calendar , connect Dock badges , connect Apple Mail , connect GitHub , connect Vercel , connect GitLab , connect Cloudflare , connect Render , connect Jira , connect Linear , connect Confluence , connect Asana , connect ClickUp , connect Todoist , connect Notion , connect Shortcut , connect Airtable , connect Reminders , connect Sentry , connect PagerDuty , connect Datadog , connect New Relic , connect Langfuse , connect Snowflake , connect Databricks , connect dbt , connect PostHog , connect Supabase , connect PostgreSQL , connect MySQL , connect ClickHouse , connect HTTP / JSON , connect RSS / Atom , connect Status pages , connect Shell command and connect Stripe .
Request a connector
Tell us which tool to connect next and the first thing you would watch in it. The next connectors come from those answers, and you get one email when yours is ready.
We'll tell you when is ready
One email to when it ships, and nothing else. A confirmation is on its way now.
This form needs JavaScript for its check that you are a person. Or write to hello@coisland.app with the tool's name.
Connector questions
Which tools does CoIsland connect to?
Today: Gmail, Calendar, Dock badges, Apple Mail, GitHub, Vercel, GitLab, Cloudflare, Render, Jira, Linear, Confluence, Asana, ClickUp, Todoist, Notion, Shortcut, Airtable, Reminders, Sentry, PagerDuty, Datadog, New Relic, Langfuse, Snowflake, Databricks, dbt, PostHog, Supabase, PostgreSQL, MySQL, ClickHouse, HTTP / JSON, RSS / Atom, Status pages, Shell command and Stripe. More connectors are on the way: request the tool you need on the connector request page, and you get an email when it is ready.
Where does CoIsland store my tokens?
On your Mac. Every connector's token is in your login Keychain, its other settings in an owner-only file in CoIsland's Application Support folder. That goes for Snowflake too: CoIsland never writes to ~/.snowflake.
Does CoIsland send my data to its own server?
No. There is no CoIsland server and no CoIsland account: the app calls each tool's API straight from your Mac. Data leaves it only when you hand an alert to an AI agent, whose own CLI sends it to its service.
Can a connector change anything in my tools?
No. CoIsland only reads. SQL on Snowflake or Databricks must start with SELECT, WITH or SHOW, and every other connector only searches and reads: it never edits, acknowledges, marks read or sends anything.
Can I connect two Snowflake accounts or two GitHub hosts?
Yes. Add as many connectors per tool as you need. Each monitor names the one it runs on, or runs on its tool's default connector.
Can I use my existing Snowflake CLI or Cortex Code connection?
Yes, when it signs in with a programmatic access token (authenticator = PROGRAMMATIC_ACCESS_TOKEN). The first time CoIsland starts, it imports those connections from ~/.snowflake under the same names; later, Import from Snowflake CLI fills the Snowflake form from one. Single sign-on and key-pair ones are not imported.
Does it work with GitHub Enterprise and Jira Data Center?
Yes: github.com, GitHub Enterprise Server and GHE.com for GitHub; Jira Cloud and Jira Data Center for Jira.
Put your work stack in the notch
Regular price: $59.99 Early bird price: $19.99 once, for 2 Macs. Native for Apple Silicon, macOS 14 and later.
Early bird price until October 25