

Monitors for your work stack
A monitor asks one of your work tools one question, on a schedule, from your Mac. When the answer holds something new, the island shows it.
What a monitor is
One question, one connector, one schedule, one rule.
CoIsland's monitors for your work stack are checks that run from your Mac on a schedule. Each one asks a single question of one connector, in that tool's own language, such as SQL for Snowflake, a GitHub search or JQL for Jira. When the answer holds something new, the island opens, a sound plays and an alert is written, ready to acknowledge, resolve or hand to an AI agent.
A monitor runs on one of the connectors listed in Connectors, every 15 minutes unless you choose otherwise. The check goes straight from your Mac to the tool's own API: no CoIsland server, no CoIsland account.
What each connector can monitor
30+ connectors today, each with its own kinds of monitor. More are on the way.
| Connector | Monitor kinds | You write |
|---|---|---|
| Gmail | Unread mail, Mail from people, Gmail search, Unread count | A Gmail search, as in Gmail's search box |
| Calendar | Meetings, Invitations and changes | The calendars to read, the minutes of warning and what to leave out |
| Dock badges | New unread, Badge over a threshold | The apps to watch, and for a threshold, the count to pass |
| Apple Mail | Unread mail, Mail from people | The mailboxes to read, and for mail from people, the addresses or domains |
| GitHub | Issues and pull requests, Review requests, Failed workflow runs, New releases, Security alerts | A GitHub search, or filters such as repo: and branch: |
| Vercel | Deployments, Stuck builds, Domain problems | A team and projects from your account, then the states or branches that count |
| GitLab | Review requests, Merge requests and issues, Failed pipelines, New releases, To-do items | Whose merge requests or issues, which projects, pipelines, releases or to-dos |
| Cloudflare | Failed Pages deployments, Worker errors, Zone problems | An account, then Pages projects, Workers and an error count, or every zone |
| Render | Failed deploys, Suspended services | Services from your workspaces, or a workspace to watch for suspended services |
| Docker | Containers down, Containers over a limit | Containers by name:, project: or image:, and for a limit, memory: or cpu: |
| Local dev | Port conflicts, Ports in use, Local server down, Heavy processes | Ports such as port:3000-3999, a program, a local address, or a memory or CPU limit |
| Jira | Issues, Status changes, Comments, SLAs, Sprint scope | JQL, as in Jira's advanced search |
| Linear | Issues, Status changes, New in triage, SLA at risk, Inbox, Project health | A Linear issue filter, or fields such as teams, states and labels |
| Confluence | Search (CQL), Mentions, Page updates, Comments, Tasks | CQL, or fields such as spaces and a look-back |
| Asana | Assigned to me, Due and overdue, New tasks in a project, Comments on my tasks | Your tasks, a project or comments, with the workspace and projects picked by name |
| ClickUp | Assigned to me, Due and overdue, New tasks in a list | Your tasks by status or due date, or a list, with Spaces and lists picked by name |
| Todoist | Due and overdue, Filter, New tasks in a project | Any Todoist filter, your due tasks, or a project picked by name |
| Notion | Database rows, Edited pages, Comments | A database picked by name and Notion's filter JSON, or the pages whose comments to watch |
| Shortcut | Stories, Entered a state, Iteration ending | A Shortcut search, as in its search bar, or a workflow state picked by name |
| Airtable | Records, Changed records | A base, table and view picked by name, and an Airtable formula |
| Reminders | Due soon and overdue, New reminders | The lists to read, the minutes of warning and a priority |
| Sentry | Issue search, Regressed & escalating, Assigned to me, Crons, uptime & metric, New releases | A Sentry search, with projects and environments |
| PagerDuty | Assigned to me, Incidents, Status changes, Acknowledged too long, On call now, Shift starting soon | Services or teams, picked by name, or your own on-call shifts |
| Datadog | Monitors alerting, Incidents, Metric threshold | States and tags, severities, or a metric monitor's query and a threshold |
| New Relic | NRQL query, Open issues | NRQL, or the priorities of the alert issues to watch |
| Langfuse | LLM errors, Cost over a limit, Slow LLM calls, Eval score below a limit, Negative user feedback | A lookback and the models or environments that count, a limit in dollars or seconds over a window, or a score and its limit or negative values |
| Snowflake | Custom SQL, Validation | SQL starting with SELECT, WITH or SHOW, or a table, a column and a condition |
| Databricks | Custom SQL, Validation, Failed job runs, Failed pipeline updates, Triggered SQL alerts | SQL on a SQL warehouse, a validation rule, or the jobs, pipelines and SQL alerts to watch |
| dbt | Failed job runs, Long runs, Source freshness | The jobs, results and lookback to watch, or a time a run must not exceed |
| PostHog | HogQL query, Insight threshold, New exceptions | HogQL, or an insight and a number, or how far back to look for new exceptions |
| Supabase | Read-only SQL, Project health, Advisor lints | SQL run as the read-only role, or the services and advisors to watch |
| PostgreSQL | Custom SQL, Validation | SQL, one read-only statement, or a validation rule |
| MySQL | Custom SQL, Validation | SQL, one read-only statement, or a validation rule |
| ClickHouse | Custom SQL, Validation, Failed queries, Long-running queries, Stuck mutations, Too many parts, Replication lag, Low disk space | SQL sent read-only, a validation rule, or a threshold on failed queries, long queries, mutations, parts, replicas or disks |
| HTTP / JSON | JSON value, New JSON items, Web page | An address, then a JSON path such as $.status and a rule, a list and its key, or a phrase a page says |
| RSS / Atom | New entries, Keywords | A feed's address, and optionally keywords |
| Status pages | Incidents, Component status, Overall status | A listed service or any status page, then the impact, components or level that count |
| Shell command | Output lines, JSON rows, Command fails | A command line: the program and its arguments, run on your Mac |
| Stripe | Failed payments, New disputes, Subscriptions, Failed payouts, Low balance | How far back to look, which subscription changes, or the balance to stay above |
Each kind knows what makes a result new. Validation writes the SQL for you from a rule such as "order_amount is greater than 1000". A failed GitHub run counts once per attempt, so a re-run that fails again alerts again. A Jira status change is an issue in a status it was not in at the last check.

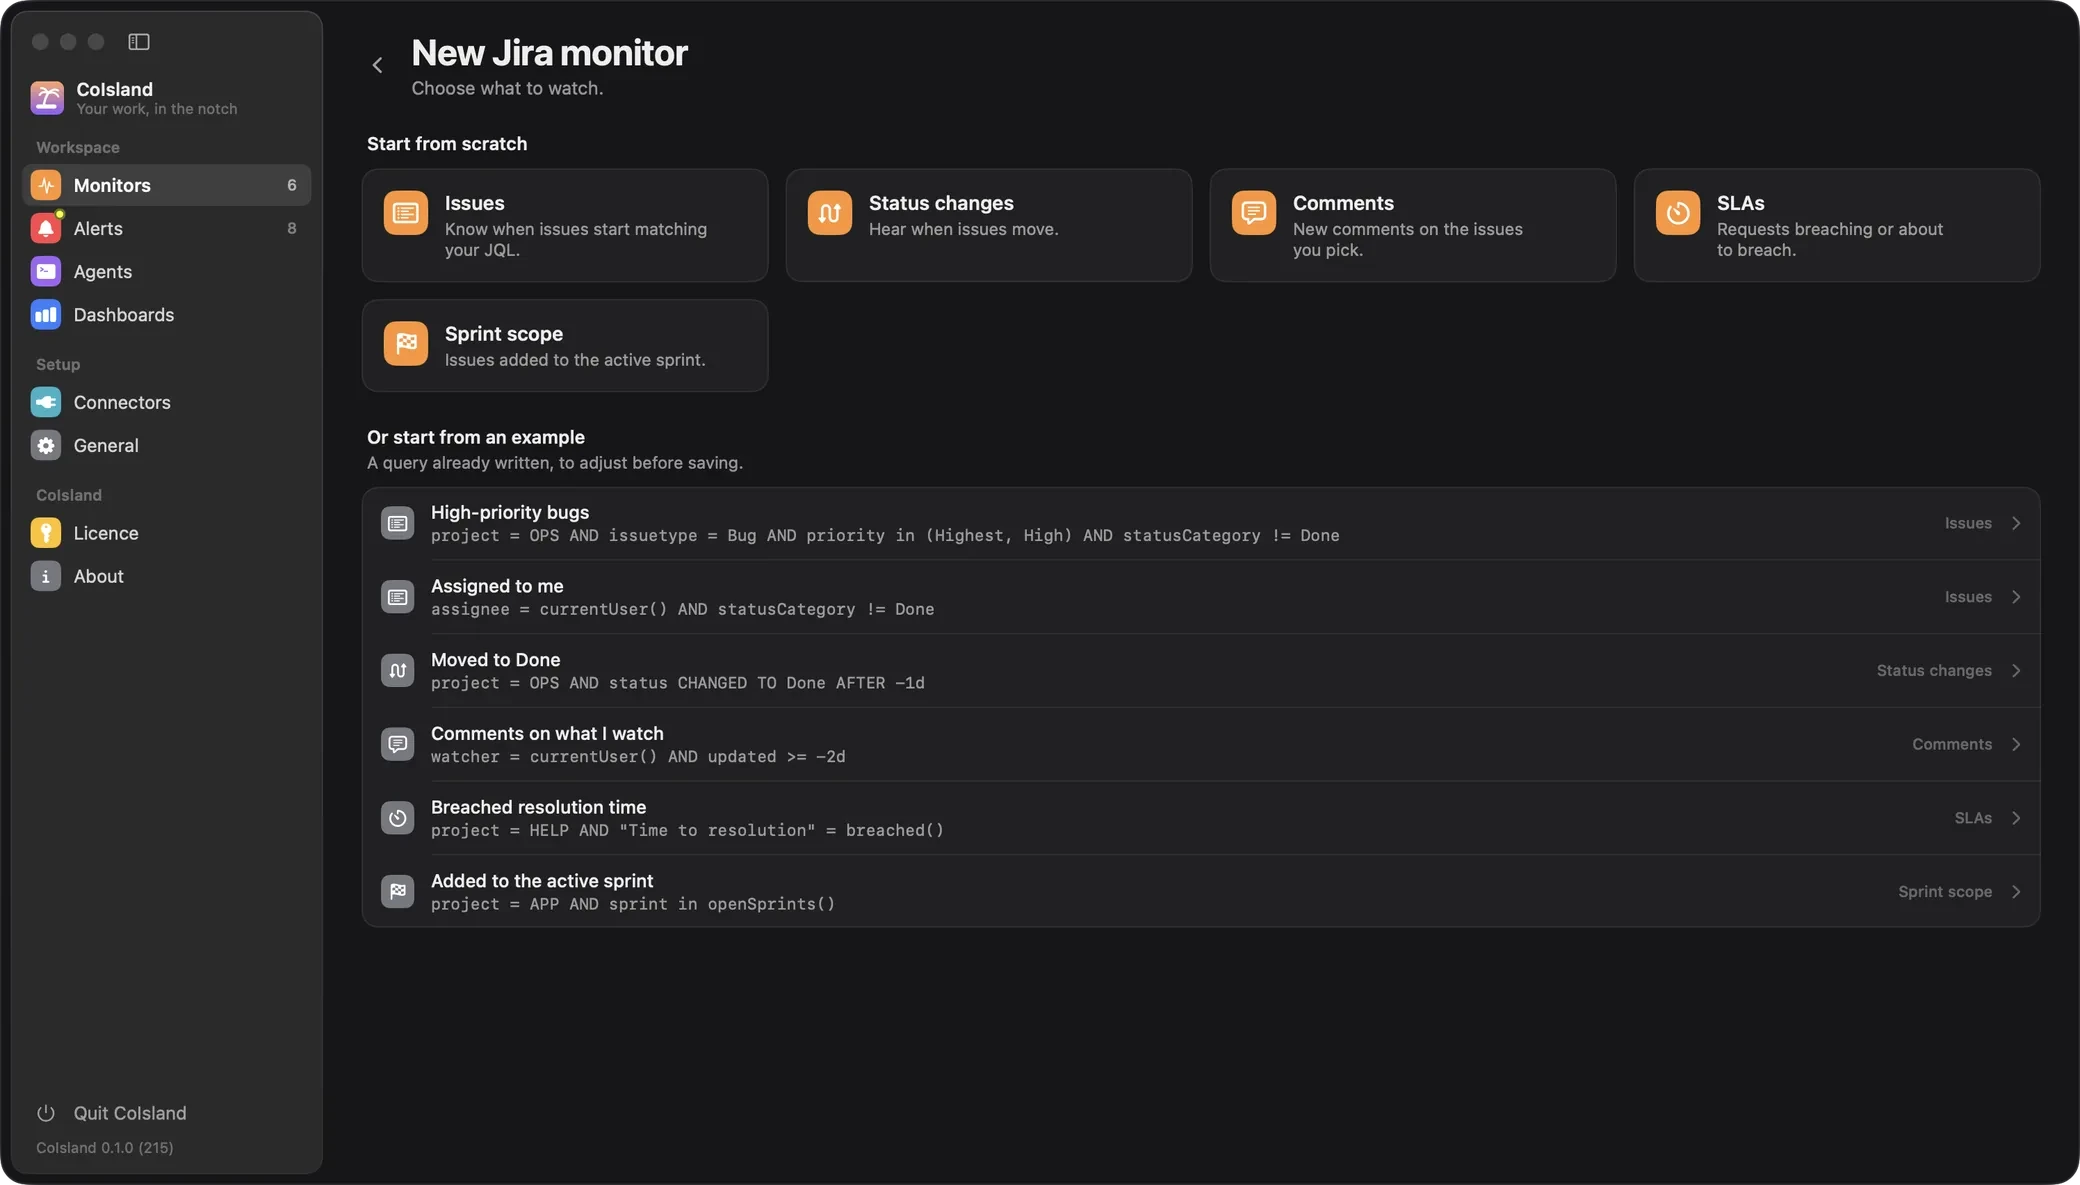
Create a monitor and test it
In Settings, open Monitors and press the plus button.
-
Choose the tool it runs on.
-
Pick a kind, or start from an example.
-
Write the query, press Test, set the rule, interval and sound, then Create Monitor.
Test runs the query once against the real tool and shows what matches now, such as "3 issues match now", with a preview. Nothing is saved, compared or alerted, so a test never moves the monitor's baseline.

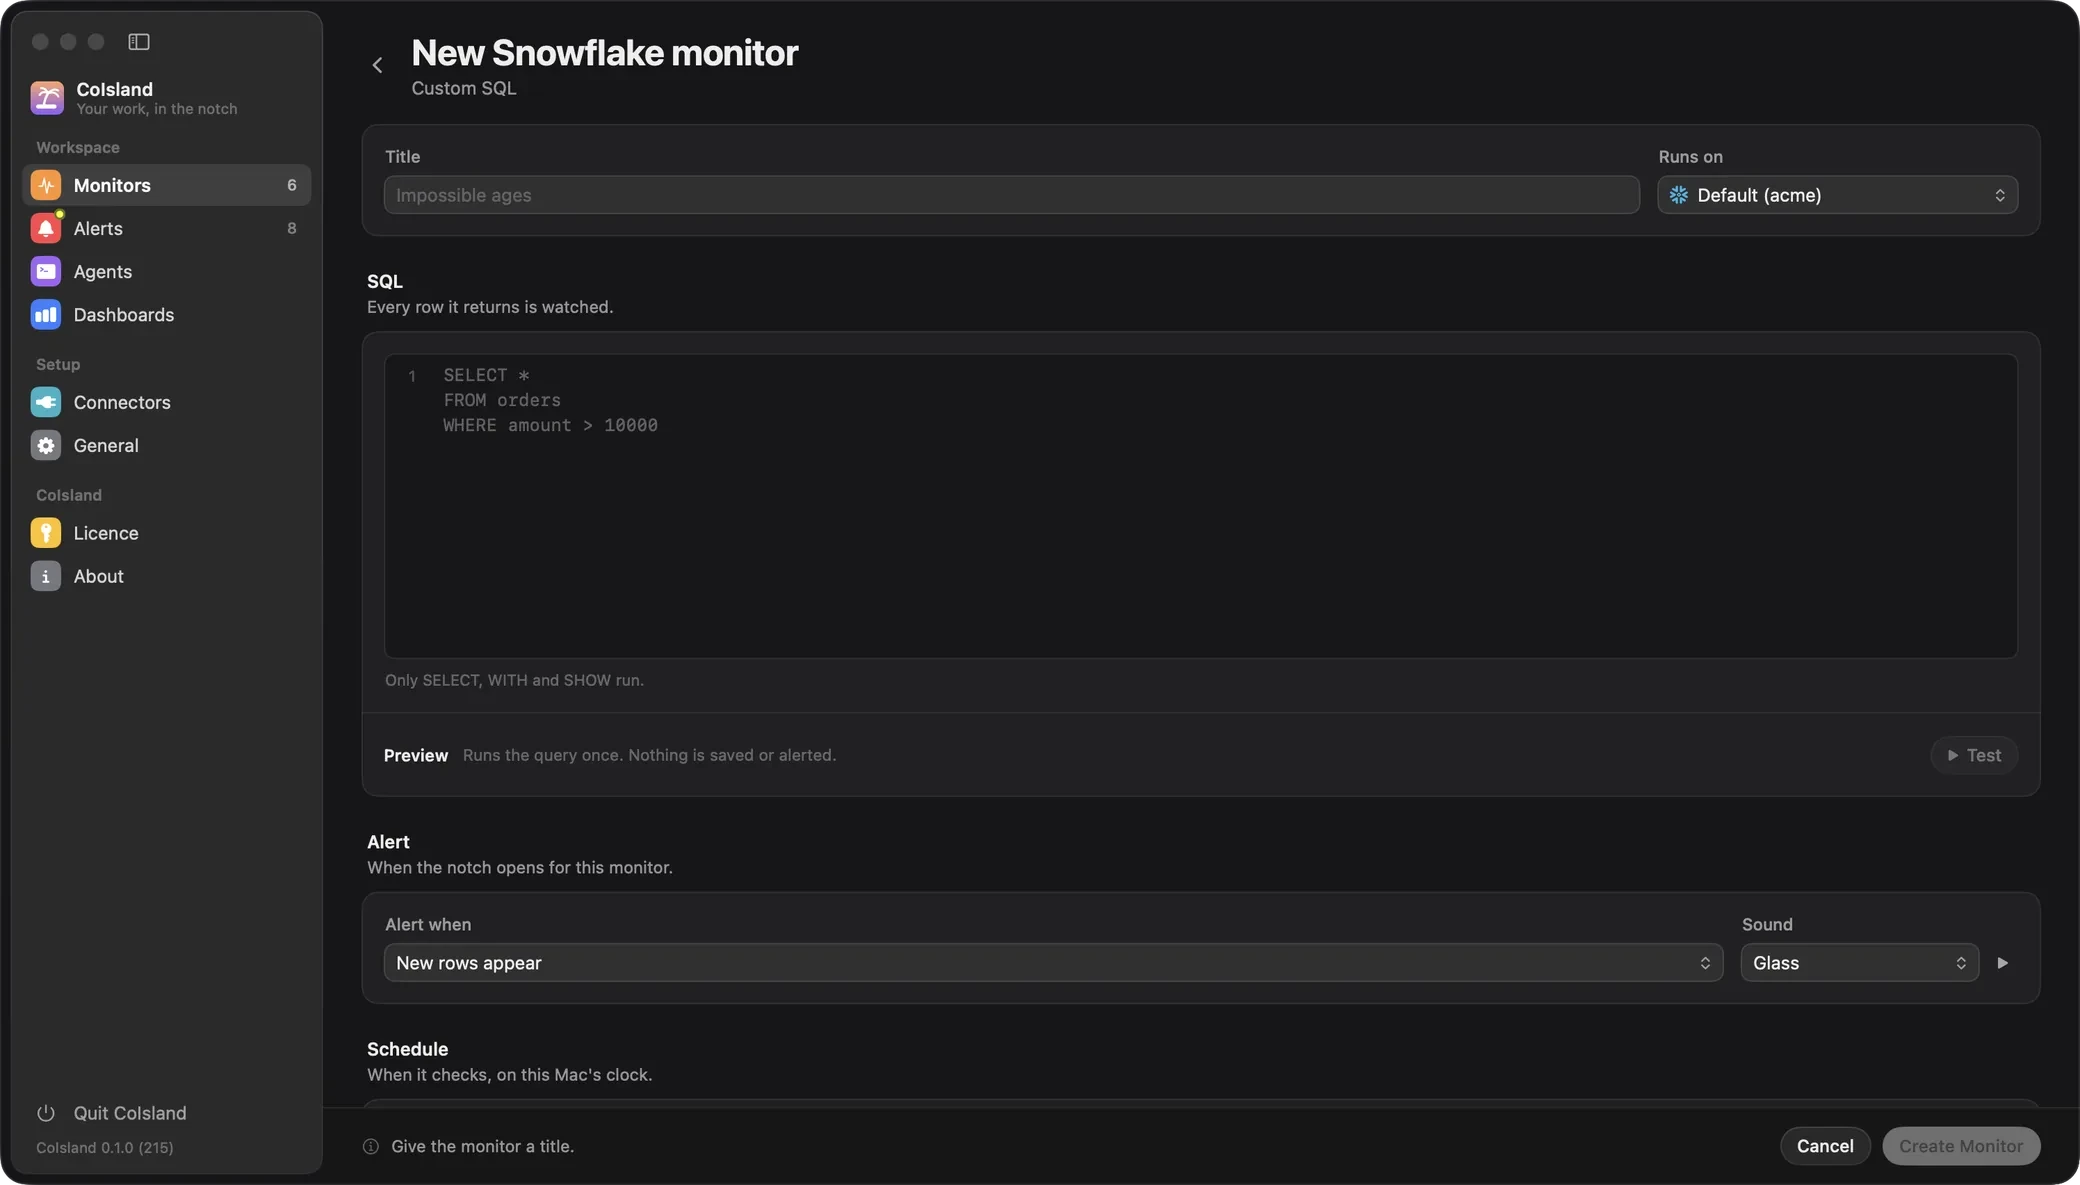
Advanced sets the columns that identify a row, a row line for the island where {COLUMN}
becomes its value, and for Snowflake the warehouse, database and schema. A check wakes a suspended warehouse that has
auto-resume on, and Snowflake bills at least 60 seconds per resume, so a small warehouse with a short auto-suspend keeps
checks cheap. Snowflake's query history shows each check under the query tag coisland: and the monitor's name.
How a check tells new from old
A fingerprint for every row, compared with the last complete check.
Each row gets a key: a SHA-256 fingerprint of the columns that identify it, which you can name. Otherwise the kind picks them (an issue's ID, a run's ID and attempt), and Custom SQL uses the whole row.
- The first check is a silent baseline: it records what already matches and alerts on nothing.
- Each later check compares its keys with the previous complete one. Rows with a new key raise one alert together.
- To compare, only fingerprints are kept, in a private file on your Mac, never row values.
- A partial answer is never compared: past 10,000 Snowflake rows or 100 GitHub results, the monitor asks you to narrow the query.
- A changed question starts over: a new query, key, connector or rule means a new baseline. A new name, interval or sound does not.
Two alert rules
New rows appear, the default, alerts on every row that entered since the last check.
Count crosses a threshold compares how many rows match with a number (greater than, at least, less than, at most, equal to, not equal to). It fires once when that becomes true, and again only after it clears. There is no silent first check: a table that is already broken says so at once.
Check interval, schedule and sound
From every 30 seconds to every 30 days, every 15 minutes by default.
- Interval. Minutes, hours or days in the form; a watch file can also use seconds, down to 30.
- On the clock. Checks land on round multiples of their interval, so monitors that share one check together and a Snowflake warehouse wakes once for them all.
- Sleep. Checks pause while your Mac sleeps or is locked. On wake, a monitor that missed checks runs once.
- Busy tools. When a tool says to slow down, the monitor backs off, from one minute up to 15.
- Sound. Glass by default, any sound in your Mac's sound folders, or None. Monitors that fire together open the island once, with one sound.
Which monitors show in the island
The island is for what needs you. The list says where each monitor stands.
Each monitor is either Always in the notch or Only when it alerts. New monitors get Always until four are set that way, so a new one never pushes out one you chose. Change it from the chip by its name.
The island holds as many rings as fit along most of your screen's edge. When they do not all fit, monitors with new rows
come first, then those in error, then those set to Always, and the last ring becomes a more ring,
+N, that opens the list. A monitor already in the island that alerts keeps its place and turns yellow.
| Chip | What it means |
|---|---|
| In notch | It has a ring in the island right now. |
| On alert | Only when it alerts, and nothing to show: it joins with new rows or an error. |
| No room | Always, but the island is full: it joins when a place frees up. |
Rows also show a line of matching rows since CoIsland opened, the count now, and a state: OK, +N new, Checking, Waiting or Error. Filters count All, New and Errors.
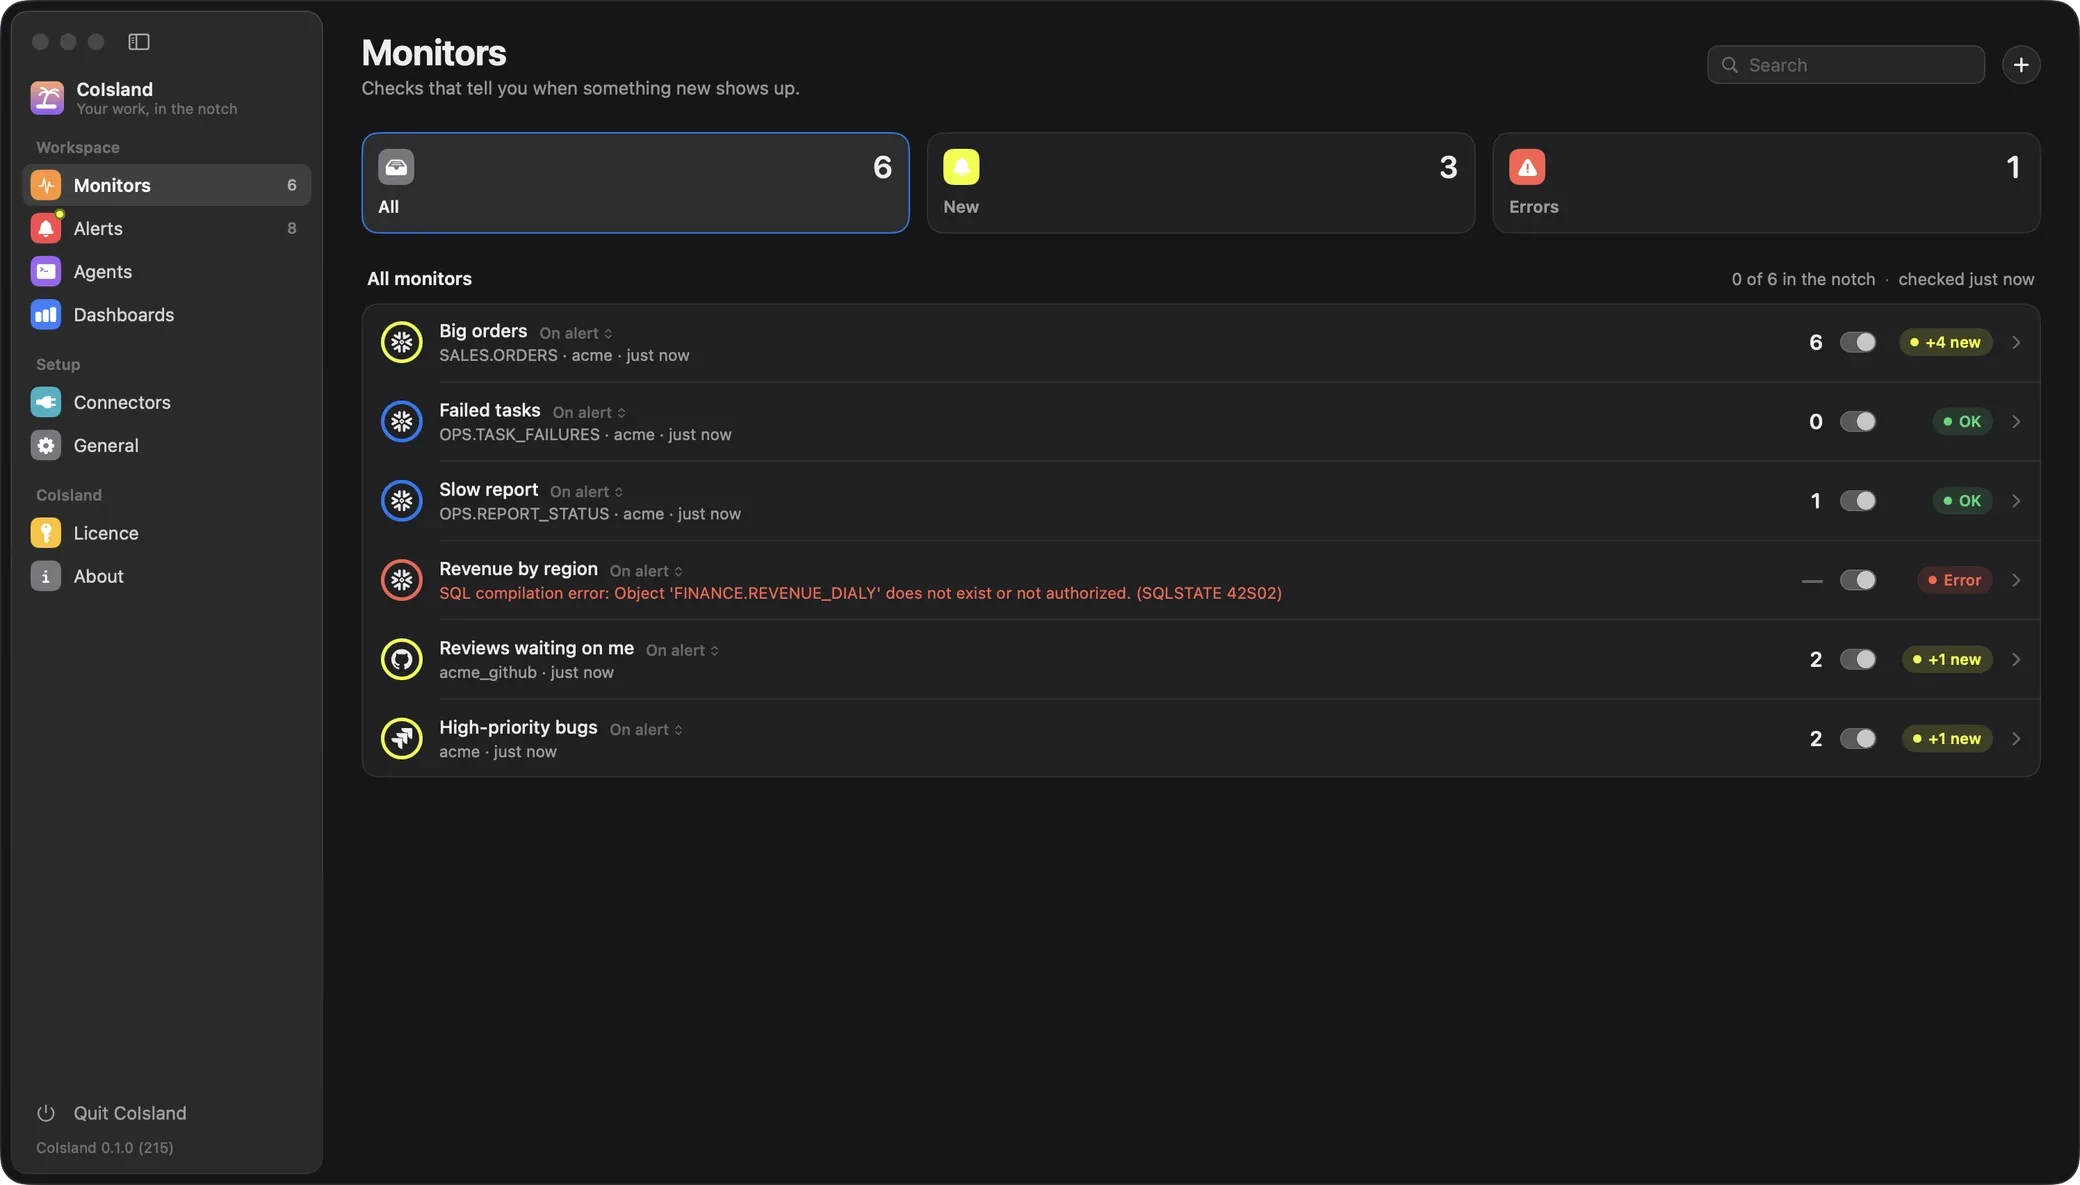
A monitor in error
A monitor that cannot run says why, such as a SQL compilation error or a missing key column. Its ring turns red, it joins the island whatever its mode, and its page opens on the message. The error clears at the next good check, or once the file is fixed, and the monitor keeps what it had seen.
The monitor page
What a monitor found, how that moved over time, and the rows themselves.
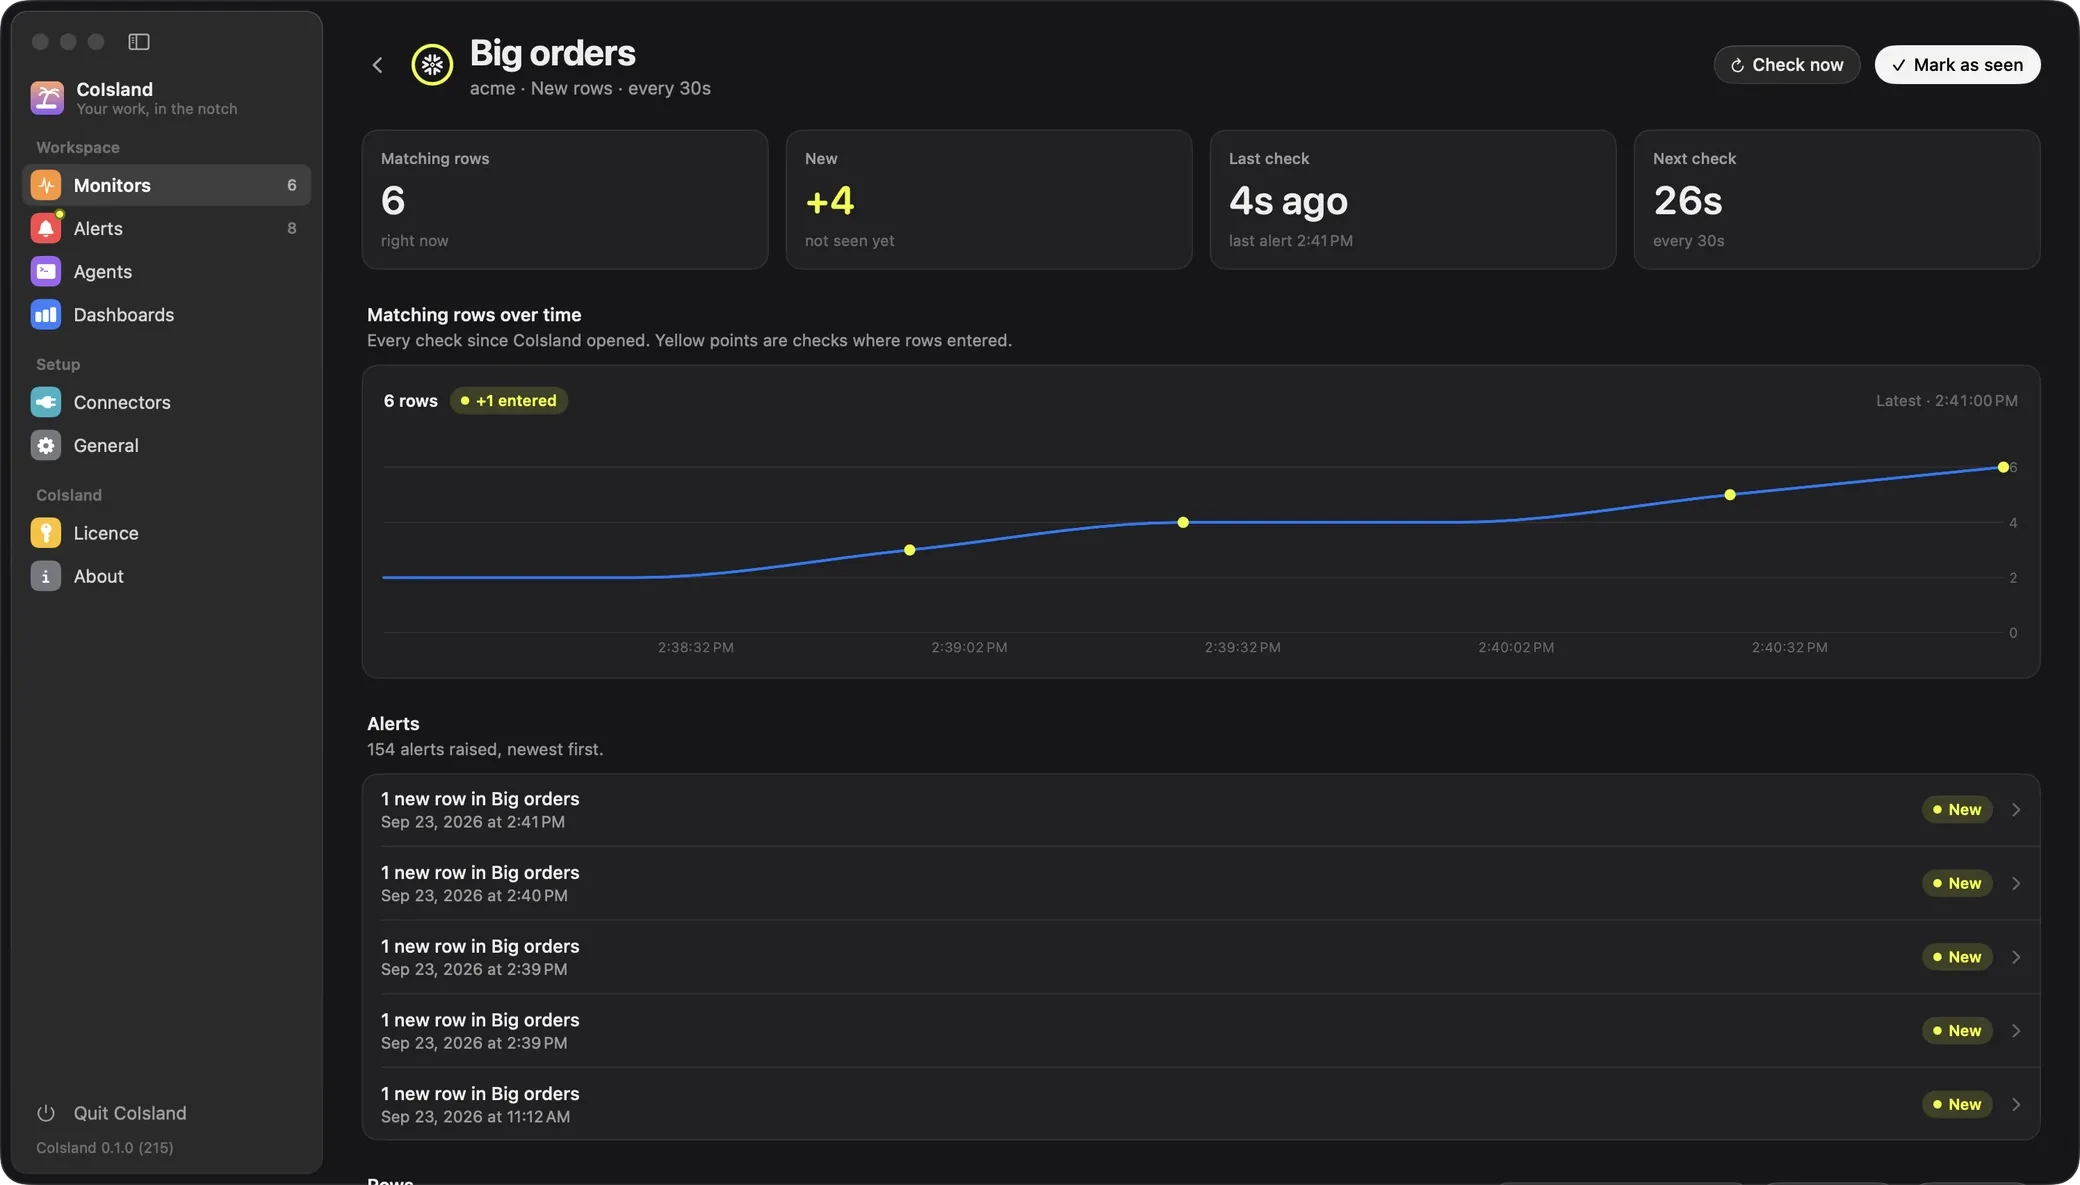
The header holds Check now, and Mark as seen while there is something new. Below it:
- Four figures: rows matching now, new rows not seen yet, the last check and a countdown to the next.
- A chart of every check since CoIsland opened, with a yellow point where rows entered.
- Its alerts, the newest five, each a click away from its own page.
- Its rows, new ones marked NEW, with a filter, Copy CSV and Export.
Dashboards add up alerts, response times and check success across every monitor.
Every monitor is a file you can keep in git
One .sql file per monitor in ~/.coisland/watches, whatever its connector.
Settings are -- key: value comment lines on top, the query below. Edit a file in any editor and the monitor
follows within a second; the form writes the same header you would. This one alerts on every Snowflake task that failed in
the last hour:
-- name: Failed tasks
-- connector: acme
-- every: 5m
-- alert: new-rows
-- key: QUERY_ID
-- title: {NAME} failed: {ERROR_MESSAGE}
SELECT query_id, name, error_message, scheduled_time
FROM TABLE(INFORMATION_SCHEMA.TASK_HISTORY(
  SCHEDULED_TIME_RANGE_START => DATEADD('hour', -1, CURRENT_TIMESTAMP()),
  RESULT_LIMIT => 1000))
WHERE state = 'FAILED'
Other connectors add a kind line. Without connector, the tool's default connector runs it:
-- name: Reviews waiting on me
-- kind: github.review-requests
-- every: 5m

user-review-requested:@me is:open draft:false
Every key is in Watch files. New to CoIsland? Start with Getting started.
Monitor questions
How often can a CoIsland monitor check?
As often as every 30 seconds and as rarely as every 30 days. A new monitor checks every 15 minutes until you change it, and checks pause while your Mac sleeps or is locked.
Why did my new monitor not alert on rows that already match?
Its first check is a silent baseline: it records what already matches, so you hear only about what is new after that. A count rule is the exception and fires at its first check if the count already crosses its threshold.
Can a Snowflake monitor change my data?
CoIsland runs a Snowflake query only if it starts with SELECT, WITH or SHOW, and refuses anything else before it reaches Snowflake. For a second safeguard, give the connector a role that can only read.
Does CoIsland send my data to its own server?
No. There is no CoIsland server and no CoIsland account. Each check goes from your Mac straight to the tool's own API, and to tell new from old a monitor keeps only fingerprints of row keys, never the values.
Is CoIsland a menu bar monitoring app?
Your monitors live in the island, where their rings show what needs you. CoIsland also has a menu bar icon with Settings, Check All Now, Acknowledge All and Open Watches Folder.
How many monitors can I have?
As many as you need. The Monitors list holds them all, and the island shows as many rings as fit, with a more ring for the rest.
What happens when a query returns too many rows?
Nothing is compared: past 10,000 rows on Snowflake or 100 results for a GitHub search, the monitor shows a warning asking you to narrow the query. A count rule can still fire when the count is known to cross its threshold.
Can I keep my monitors in git?
Yes. Each monitor is a plain .sql file in ~/.coisland/watches, so you can version the folder, review changes and edit monitors in any editor.
Work with AI. Stay in control.
CoIsland Community is free, for good. Lifetime from $29, paid once. Native for Apple Silicon, macOS 14 and later.