For data teams: your warehouse in the notch
For data teams who own a warehouse: failed tasks, rows that break a rule and tables that stop loading reach your Mac's notch first, next to the pull request and the ticket.
What goes wrong
-
A task fails overnight
You hear about it when a dashboard is wrong in the morning.
-
Bad or late rows land
Nulls, duplicates and a table that stopped loading, before anyone looks.
-
The cause is elsewhere
A merged pull request changed the model, and the incident waits in Jira.
What CoIsland watches
One monitor per question, in each tool's own language, reporting to the notch.
Data teams often learn about a broken pipeline from the person whose dashboard is wrong. CoIsland moves that moment earlier: it runs your own read-only checks against your warehouse and your other tools from your Mac, and when one finds something new, the notch opens with an alert. The home page shows those notch cards.
How data teams use CoIsland in a day
Overnight, a Snowflake task failed
Snowflake task failure monitoring starts with TASK_HISTORY. This Snowflake monitor looks back 24 hours, so a run that failed at 3 a.m. is still there when your Mac wakes: checks pause during sleep, and a monitor that missed its checks runs once on wake.
-- name: Failed tasks
-- every: 5m
-- alert: new-rows
-- key: NAME, SCHEDULED_TIME
-- title: {NAME} failed: {ERROR_MESSAGE}
SELECT name, database_name, schema_name, scheduled_time, error_message
FROM TABLE(ANALYTICS.INFORMATION_SCHEMA.TASK_HISTORY(
    SCHEDULED_TIME_RANGE_START => DATEADD('hour', -24, CURRENT_TIMESTAMP()),
    ERROR_ONLY => TRUE))
ERROR_ONLY => TRUE keeps the runs that failed or were cancelled, and each alerts once. The role needs ownership of the tasks, MONITOR or OPERATE on them, or the global MONITOR EXECUTION privilege. Settings › Monitors also has a failed-tasks example to start from.
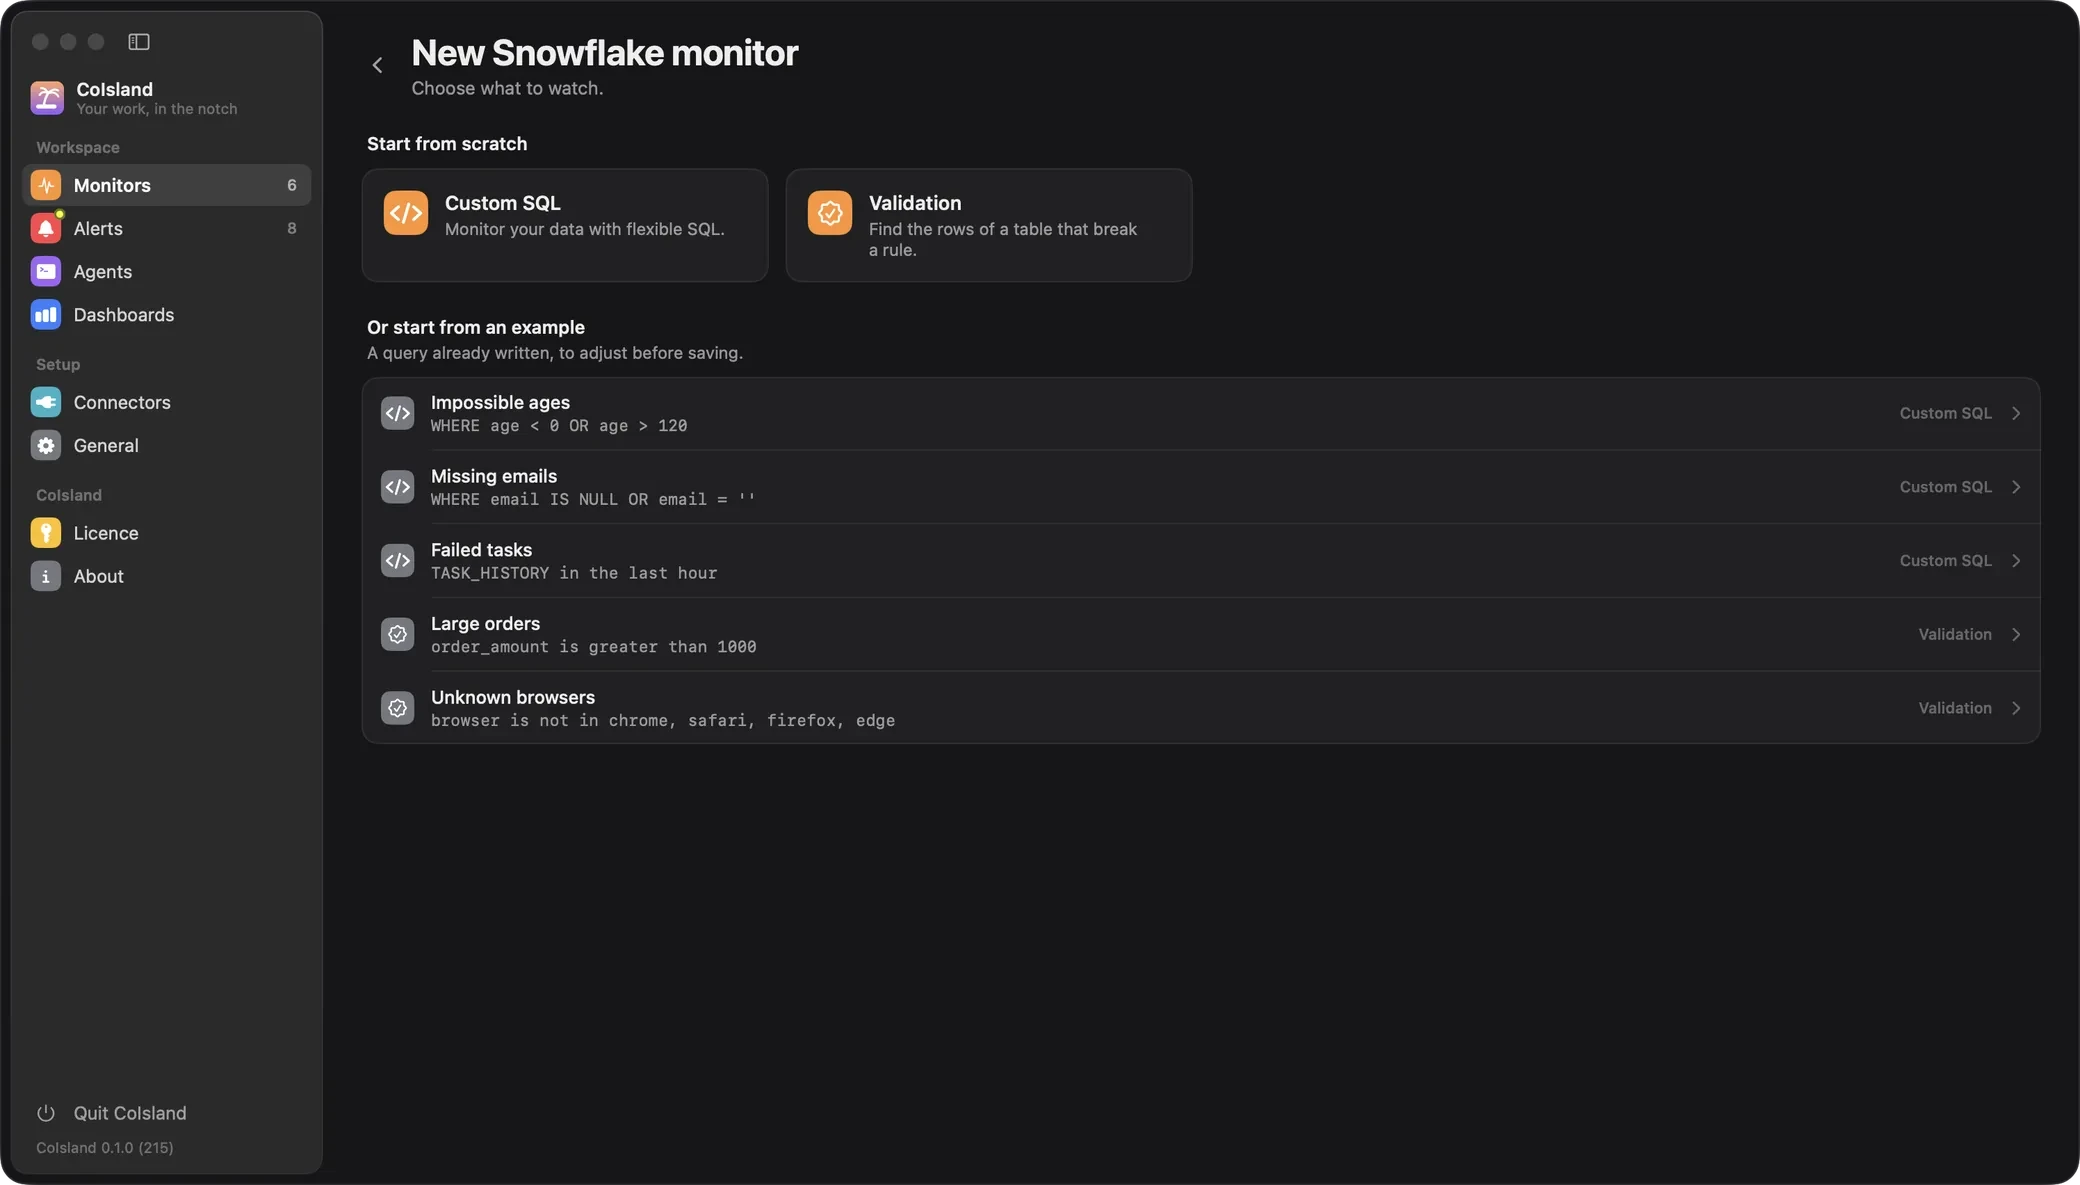
Mid-morning, rows break a rule
A Validation monitor needs no SQL. Pick a table, a column and a condition (is null, is null or empty, greater or less than, equal or not equal to, not in a set), and CoIsland writes SELECT * FROM analytics.marts.fct_orders WHERE customer_id IS NULL for you.
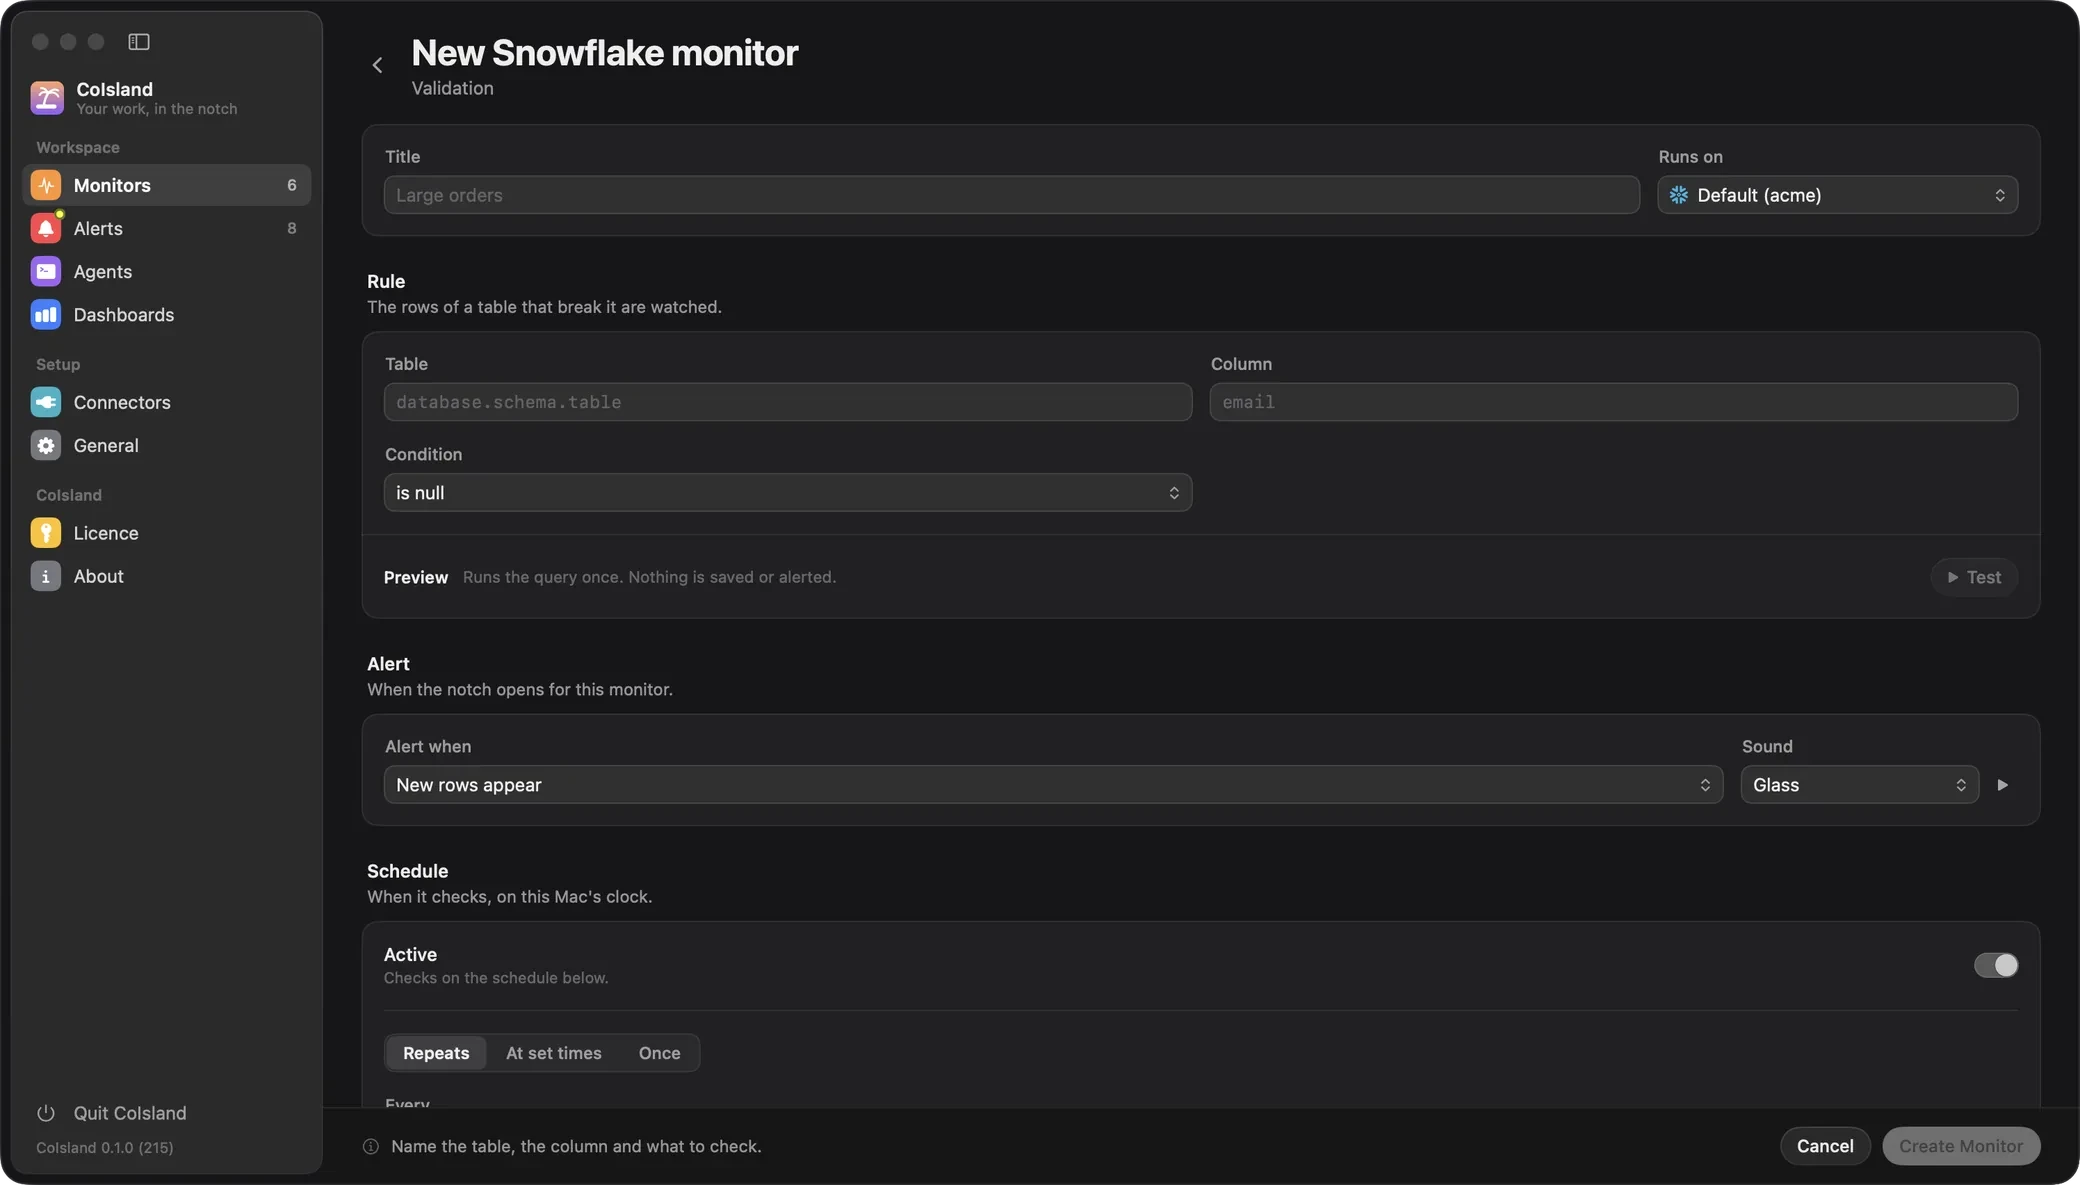
Saved, it is a Custom SQL monitor like any other, so you can widen its query later.
After lunch, a table stops loading
Some problems are a number. Besides new rows, a monitor can alert on the row count, such as count > 0: it fires once, when the rule becomes true, and again only after it has been false. That suits freshness:
-- name: Orders are stale
-- every: 30m
-- alert: count > 0
SELECT last_load,
       DATEDIFF('minute', last_load, CURRENT_TIMESTAMP()) AS minutes_late
FROM (SELECT MAX(loaded_at) AS last_load FROM analytics.raw.orders)
WHERE last_load < DATEADD('hour', -2, CURRENT_TIMESTAMP())
A volume spike works the same way: select the last hour’s rejected rows with alert: count > 500. CoIsland reads up to 10,000 rows of a result, so for bigger volumes, count in SQL.
The pull request behind it
A broken model often starts with a merge. If your dbt project lives on GitHub, a Failed workflow runs monitor watches the last 7 days of runs, and a re-run that fails again alerts again:
repo:acme/analytics branch:main workflow:dbt-build.ymlA Review requests monitor catches the changes waiting on your team: team-review-requested:acme/data is:open draft:false. Both need only a fine-grained, read-only token.
The Jira ticket for the incident
A Jira Issues monitor alerts when an issue starts matching your JQL, so a new incident reaches you before anyone assigns it:
project = DATA AND labels = "data-incident" AND statusCategory != DoneStatus changes tells you when one moves, and on Jira Service Management, SLAs catches requests close to a breach.
Hand the alert to an agent
Pick an agent on the alert. It opens in a terminal under it, and its first message is the whole alert: facts, SQL, rows and activity. Cortex Code, Snowflake’s agent, runs on its own connections in ~/.snowflake/connections.toml, the Snowflake CLI’s file. Claude Code or Codex suit a fix in the model’s code. Each starts in the mode that asks first: Claude Code in Manual permission mode, Codex in a read-only sandbox, Cortex Code in its default mode, which asks before risky actions.
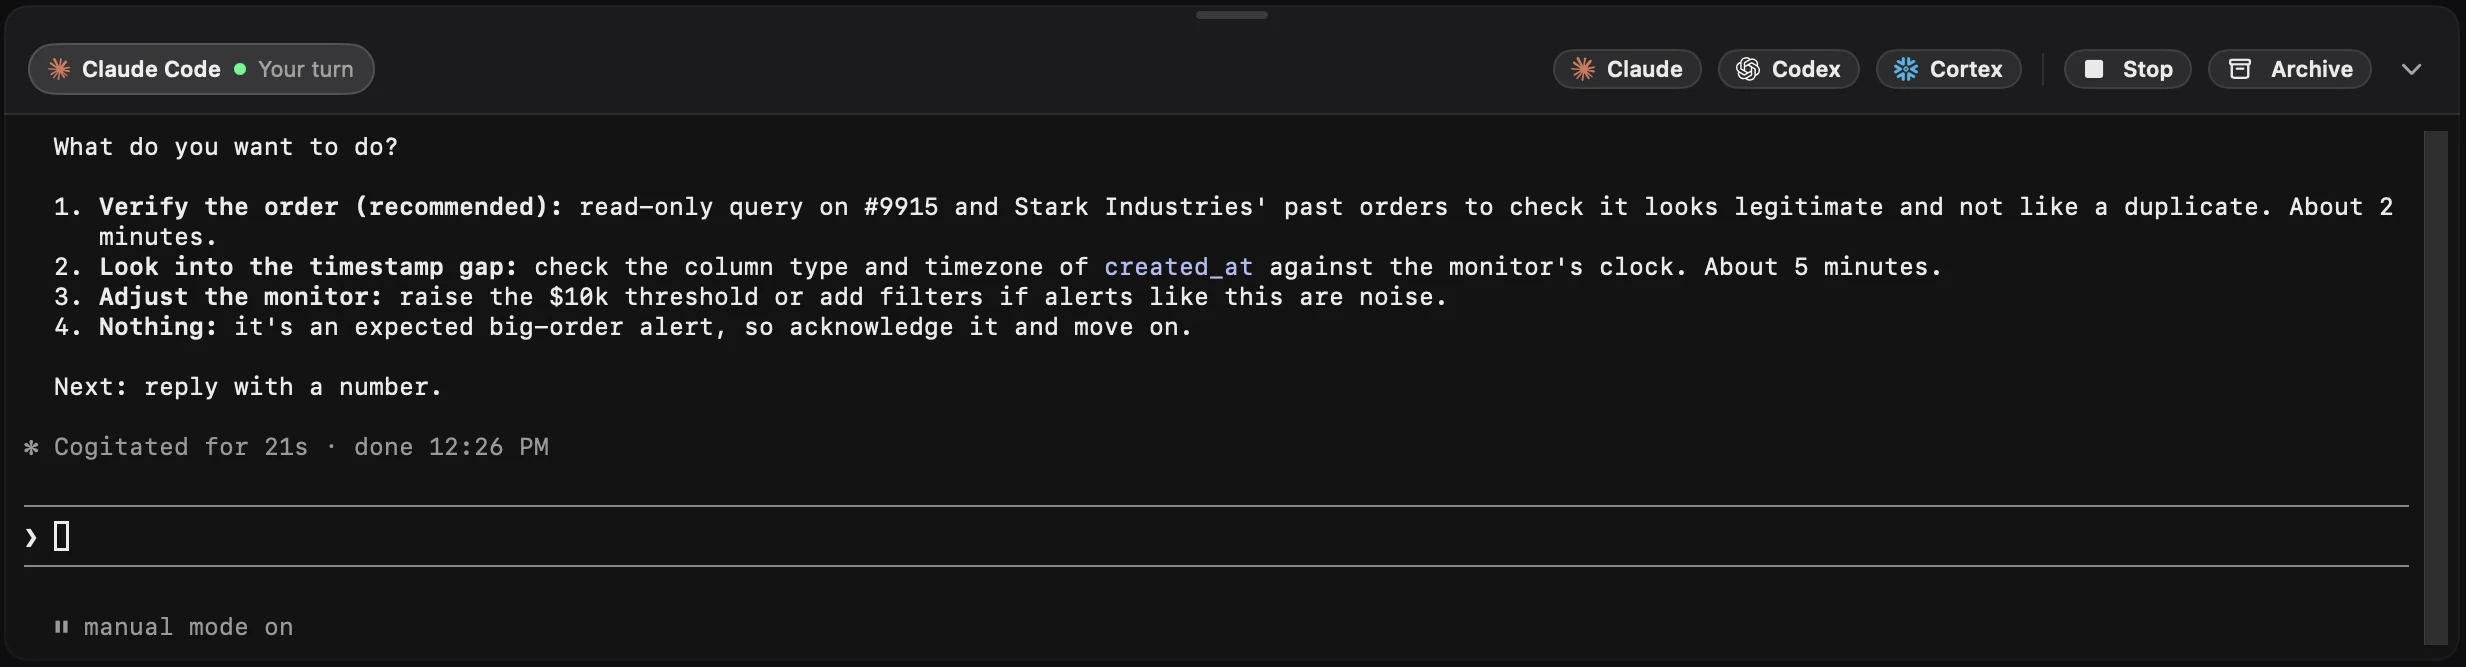
The Agents section keeps each session to resume, stop or archive. More on agents.
Friday, the noisy monitors
Dashboards cover 24 hours, 7 or 30 days: alerts raised, open alerts, actionability (the share someone handled), response times and check success. Noisiest monitors ranks the loudest, and Monitor health shows a query that broke after a column rename as Failing.
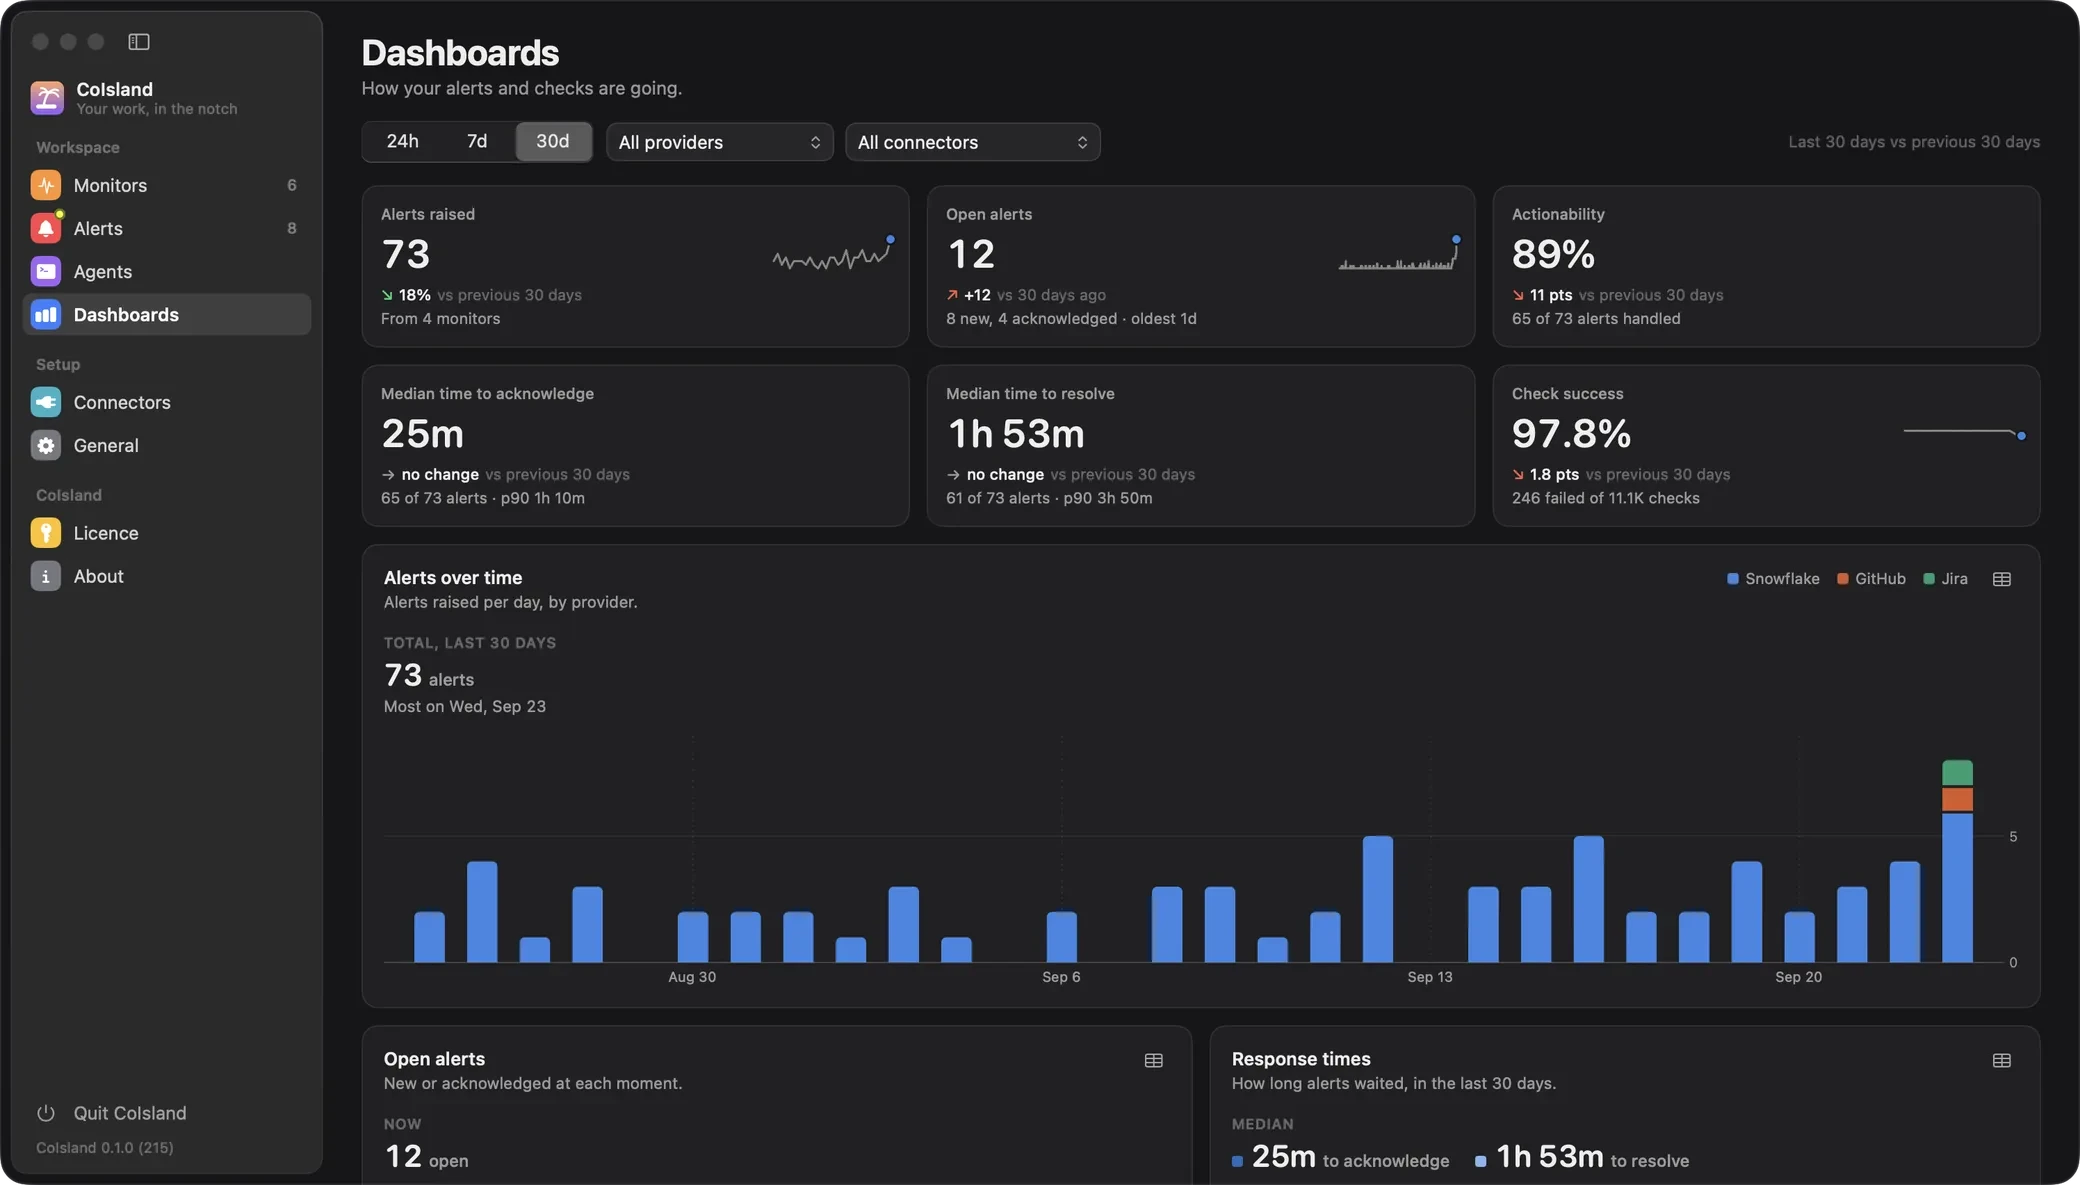
Data quality alerts as a watch file
Every monitor is a .sql file in ~/.coisland/watches. Its first comment lines are its settings; for Snowflake the rest is the query, and the whole file runs. A saved file is picked up within a second. A complete data-quality monitor:
-- name: Orders without a customer
-- connector: acme
-- warehouse: MONITOR_XS
-- database: ANALYTICS
-- schema: MARTS
-- every: 10m
-- alert: new-rows
-- key: ORDER_ID
-- title: Order {ORDER_ID} from {ORDER_DATE} has no customer
-- sound: Glass
-- icon: checkmark.seal
SELECT order_id, order_date, amount, loaded_at
FROM fct_orders
WHERE customer_id IS NULL
AND order_date >= DATEADD('day', -7, CURRENT_DATE())connector,warehouse,databaseandschemasay where it runs, else the connector’s defaults apply.keyidentifies a row: an order that enters the result alerts once, one already there stays quiet, and the first check only records what is there.titleis the row’s line in the notch.- The query must start with
SELECT,WITHorSHOW; anything else is refused.
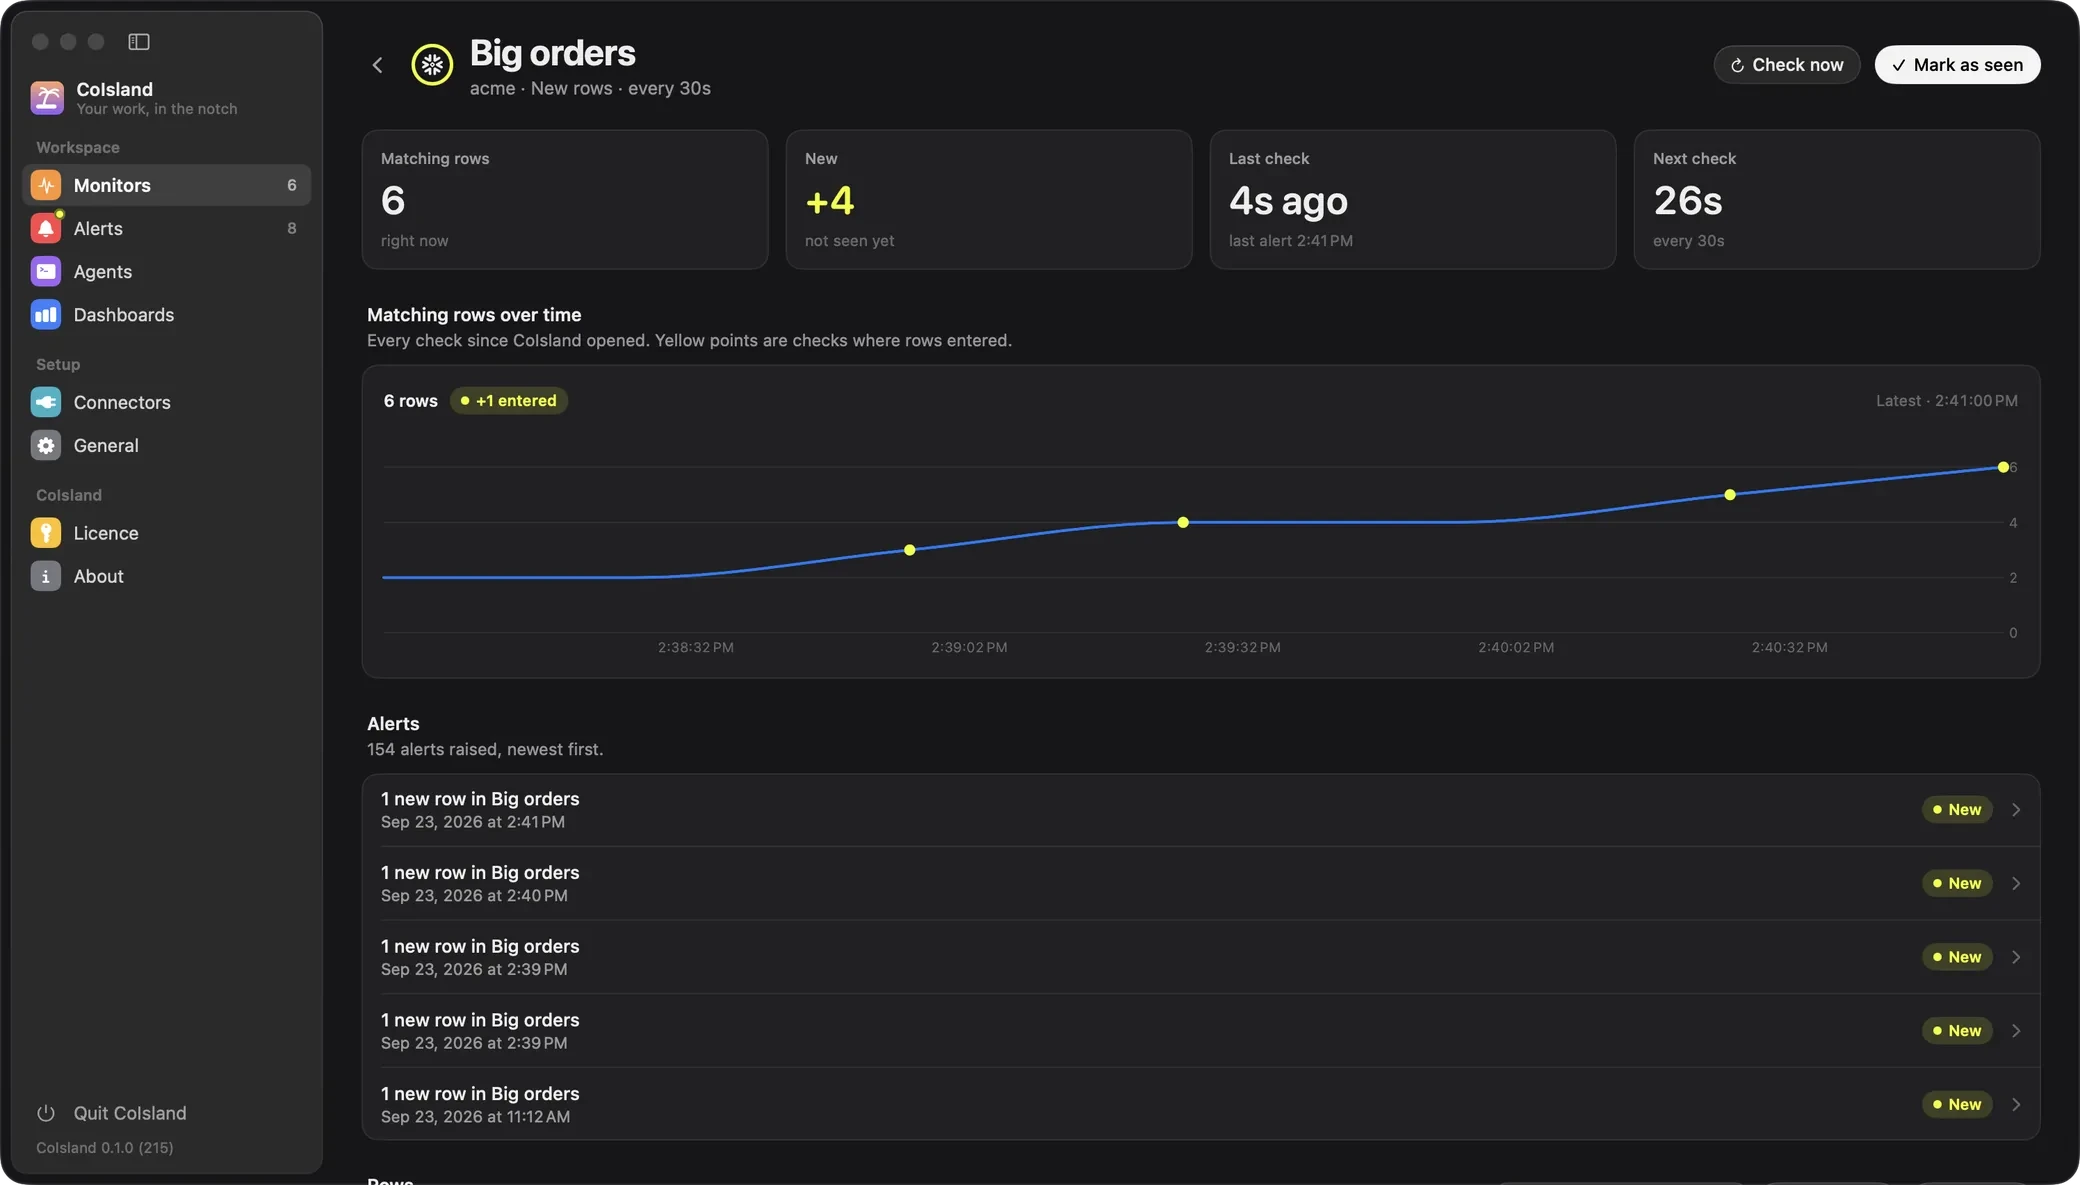
Every key is in watch files. Each monitor also gets its own page:
Data observability for small teams: where CoIsland stops
If you need lineage, anomaly detection learned from history, or every table covered without writing a query, you need a data observability platform. CoIsland runs the checks you write, on your warehouse and your role, with no CoIsland server: it talks only to your tools’ own APIs, and your tokens stay on your Mac. It is not:
- Lineage. It does not know which dashboards read a table.
- Anomaly detection. A rule is new rows, or a count against your number.
- Always on. It checks while your Mac is awake and unlocked, and pages nobody.
- Shared. Each person runs it on their own Mac.
You can keep both. The Snowflake alerts guide compares it with Snowflake’s own alerts, CoIsland for engineering covers reviews and CI, and every team is on use cases.
Then an agent takes it
Hand the alert to Cortex Code, which runs on your Snowflake connection, or to Claude Code or Codex. Its first message is the whole alert: the SQL, the rows and the activity. It sums it up, then asks before it acts.
-
Claude Code
Anthropic's coding agent, in its own CLI.
-
Codex
OpenAI's coding agent, in its own CLI.
-
Cortex Code
Snowflake's coding agent, in its own CLI.
Questions
Can CoIsland alert me when a Snowflake task fails?
Yes. Write a Custom SQL monitor on Snowflake's TASK_HISTORY table function with ERROR_ONLY => TRUE, or start from the Failed tasks example in Settings › Monitors. Each failed run alerts once. The connector's role must be allowed to see the runs: ownership of the task, MONITOR or OPERATE on it, or the global MONITOR EXECUTION privilege.
Does CoIsland change data in our warehouse?
No. A Snowflake monitor must start with SELECT, WITH or SHOW, and CoIsland refuses anything else before it runs. It uses your own connection, role and warehouse, and it only reads from your other tools.
How much warehouse time do the checks use?
Each check is one query on the warehouse you choose. The default interval is 15 minutes, so a warehouse with a short AUTO_SUSPEND can suspend between checks, and monitors that share an interval run at the same moments, so the warehouse resumes once for all of them. Every check carries the query tag coisland: plus the monitor's name, so you can find it in query history.
Does CoIsland keep checking while my Mac is asleep?
No. Checks pause while the Mac sleeps, its screens are off or it is locked. When it wakes, each monitor that missed checks runs once, so give a failed-task query a window that covers the night, such as the last 24 hours.
Is CoIsland a data observability platform?
No. It has no lineage, no anomaly detection learned from history and no automatic coverage of every table. CoIsland runs the checks you write, from your Mac, and shows what they find in the notch. You can use it next to a platform that does those things.
Can our whole data team share the same monitors?
Each person runs CoIsland on their own Mac with their own connectors; there is no team account. Every monitor is a plain .sql file in ~/.coisland/watches, so a team can keep them in a git repository and each person copies the ones they want.
Does Cortex Code need a separate sign-in?
No. Cortex Code runs on the Snowflake connections in ~/.snowflake/connections.toml, the file the Snowflake CLI uses, which CoIsland imports connectors from but never writes. General › AI Agents shows its version, where it is installed and the connection it uses.
Can I monitor data pipelines from a Mac without running a server?
Yes. CoIsland is a native app for Apple Silicon Macs on macOS 14 or later. Checks go straight from your Mac to your tools' own APIs: there is no CoIsland server and no CoIsland account, and your tokens stay on the Mac. It is a one-time licence, for up to 2 Macs with a year of updates.
Other teams
-
Engineering
Engineering teams lose time to review queues, red builds and security alerts spread across tools. CoIsland watches GitHub and the rest of your tools and puts what needs you in your Mac's notch.
Put your work stack in the notch
Regular price: $59.99 Early bird price: $19.99 once, for 2 Macs. Native for Apple Silicon, macOS 14 and later.
Early bird price until October 25