CoIsland use cases for your team
Every use case here runs on one loop: a monitor watches a tool you work with, the change reaches your Mac's notch as an alert, and an AI agent picks it up and asks before it acts.
The loop every team shares
-
A monitor asks one tool one question in its own language: SQL for Snowflake, a GitHub search, JQL for Jira. It checks every 15 minutes by default.
-
New rows or items, or a count past the line you set, raise an alert. Its ring in the notch pulses and the notch opens for a few seconds, with a sound if you want one.
-
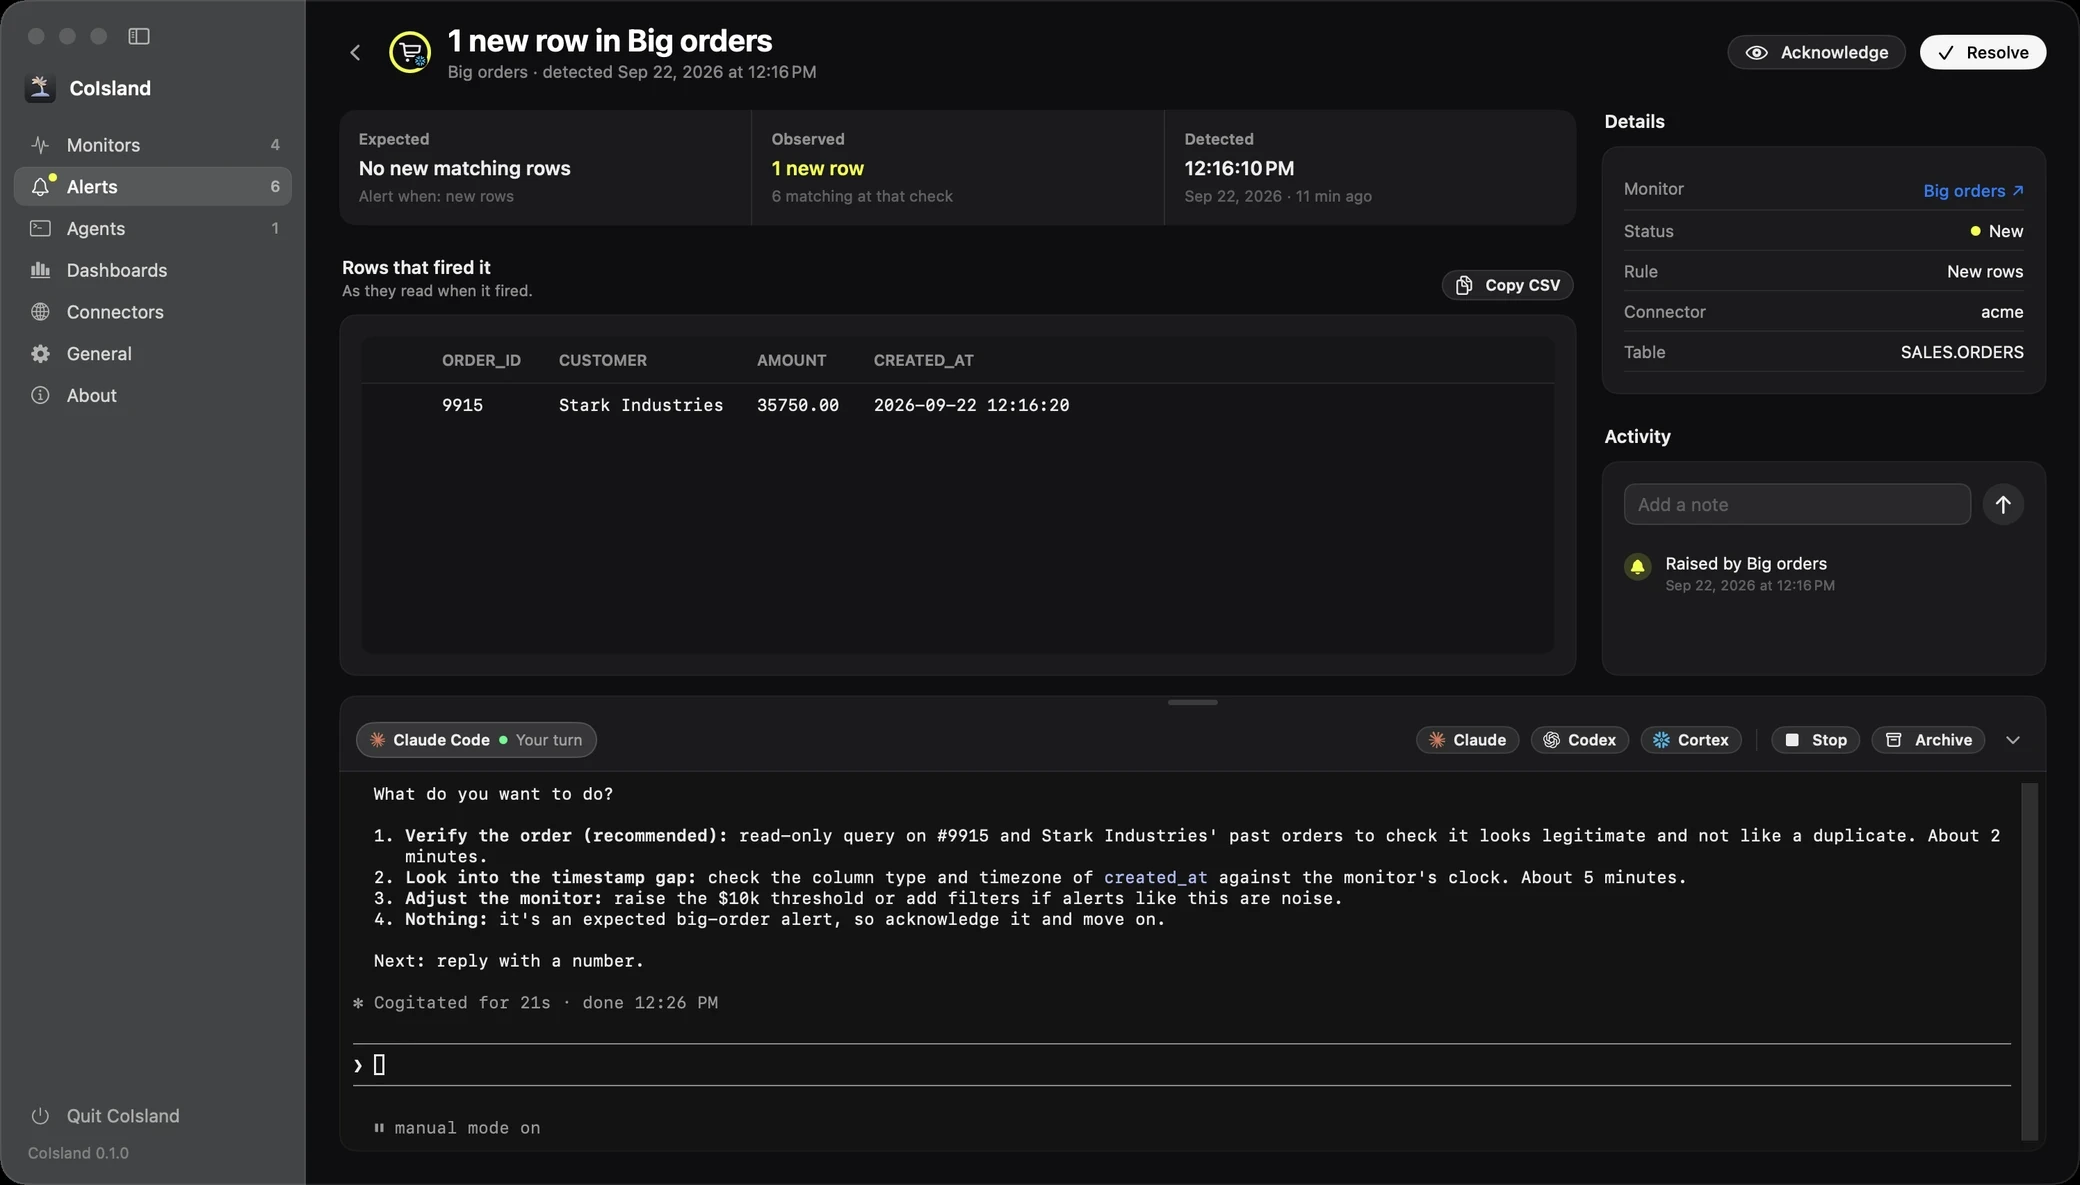
Hand the alert to Claude Code, Codex or Cortex Code. The agent reads the whole alert first and asks before it changes anything.
CoIsland is a notch app for work. Each monitor is a ring counting down to its next check, with its match count under it. Click a ring to open its newest alert; press and hold it to mark what is new as seen. The home page shows the notch cards.
Alert triage with AI agents happens right there: the agent runs its own CLI in a terminal under the alert, and you answer its plan. Agents covers all three.
Use cases by team
Each team page follows one team across at least two connectors: what goes wrong, what CoIsland watches, what the agent does next.
-
Data teams
For data teams who own a warehouse: failed tasks, rows that break a rule and tables that stop loading reach your Mac's notch first, next to the pull request and the ticket.
What it watches
-
Snowflake Failed tasks, rows that break a rule, stale tables and volume spikes, in read-only SQL.
-
GitHub The pipeline's failed workflow runs and the pull requests waiting on your review.
-
Jira Data incidents as they start matching your JQL, their status changes and SLAs.
-
-
Engineering
Engineering teams lose time to review queues, red builds and security alerts spread across tools. CoIsland watches GitHub and the rest of your tools and puts what needs you in your Mac's notch.
What it watches
-
GitHub Review requests for you or your team, failed workflow runs, new releases, and Dependabot, code scanning and secret scanning alerts.
-
Jira Bugs assigned to you, status changes, new comments and issues added to the active sprint, on Jira Cloud or Data Center.
-
Who watches what: tech stack monitoring by role
Monitors that exist in the app today, by the role that usually owns them.
| Role | Monitors to start with |
|---|---|
| Data engineer | Custom SQL (Snowflake) for failed tasks; Failed workflow runs (GitHub) on the pipeline repository. |
| Analytics engineer | Validation (Snowflake) for nulls, out-of-range values or a status outside a set; Review requests (GitHub). |
| Software engineer | Review requests and Failed workflow runs (GitHub); Issues (Jira) for assignee = currentUser() AND statusCategory != Done. |
| Tech lead | Security alerts and New releases (GitHub); Sprint scope (Jira). |
| On-call | Assigned to me and Shift starting soon (PagerDuty); Failed workflow runs (GitHub) on the deploy workflow. |
Each connector page lists its monitors, and Connectors has them all side by side. The Monitors page explains the rules they share.
How teams share monitors today
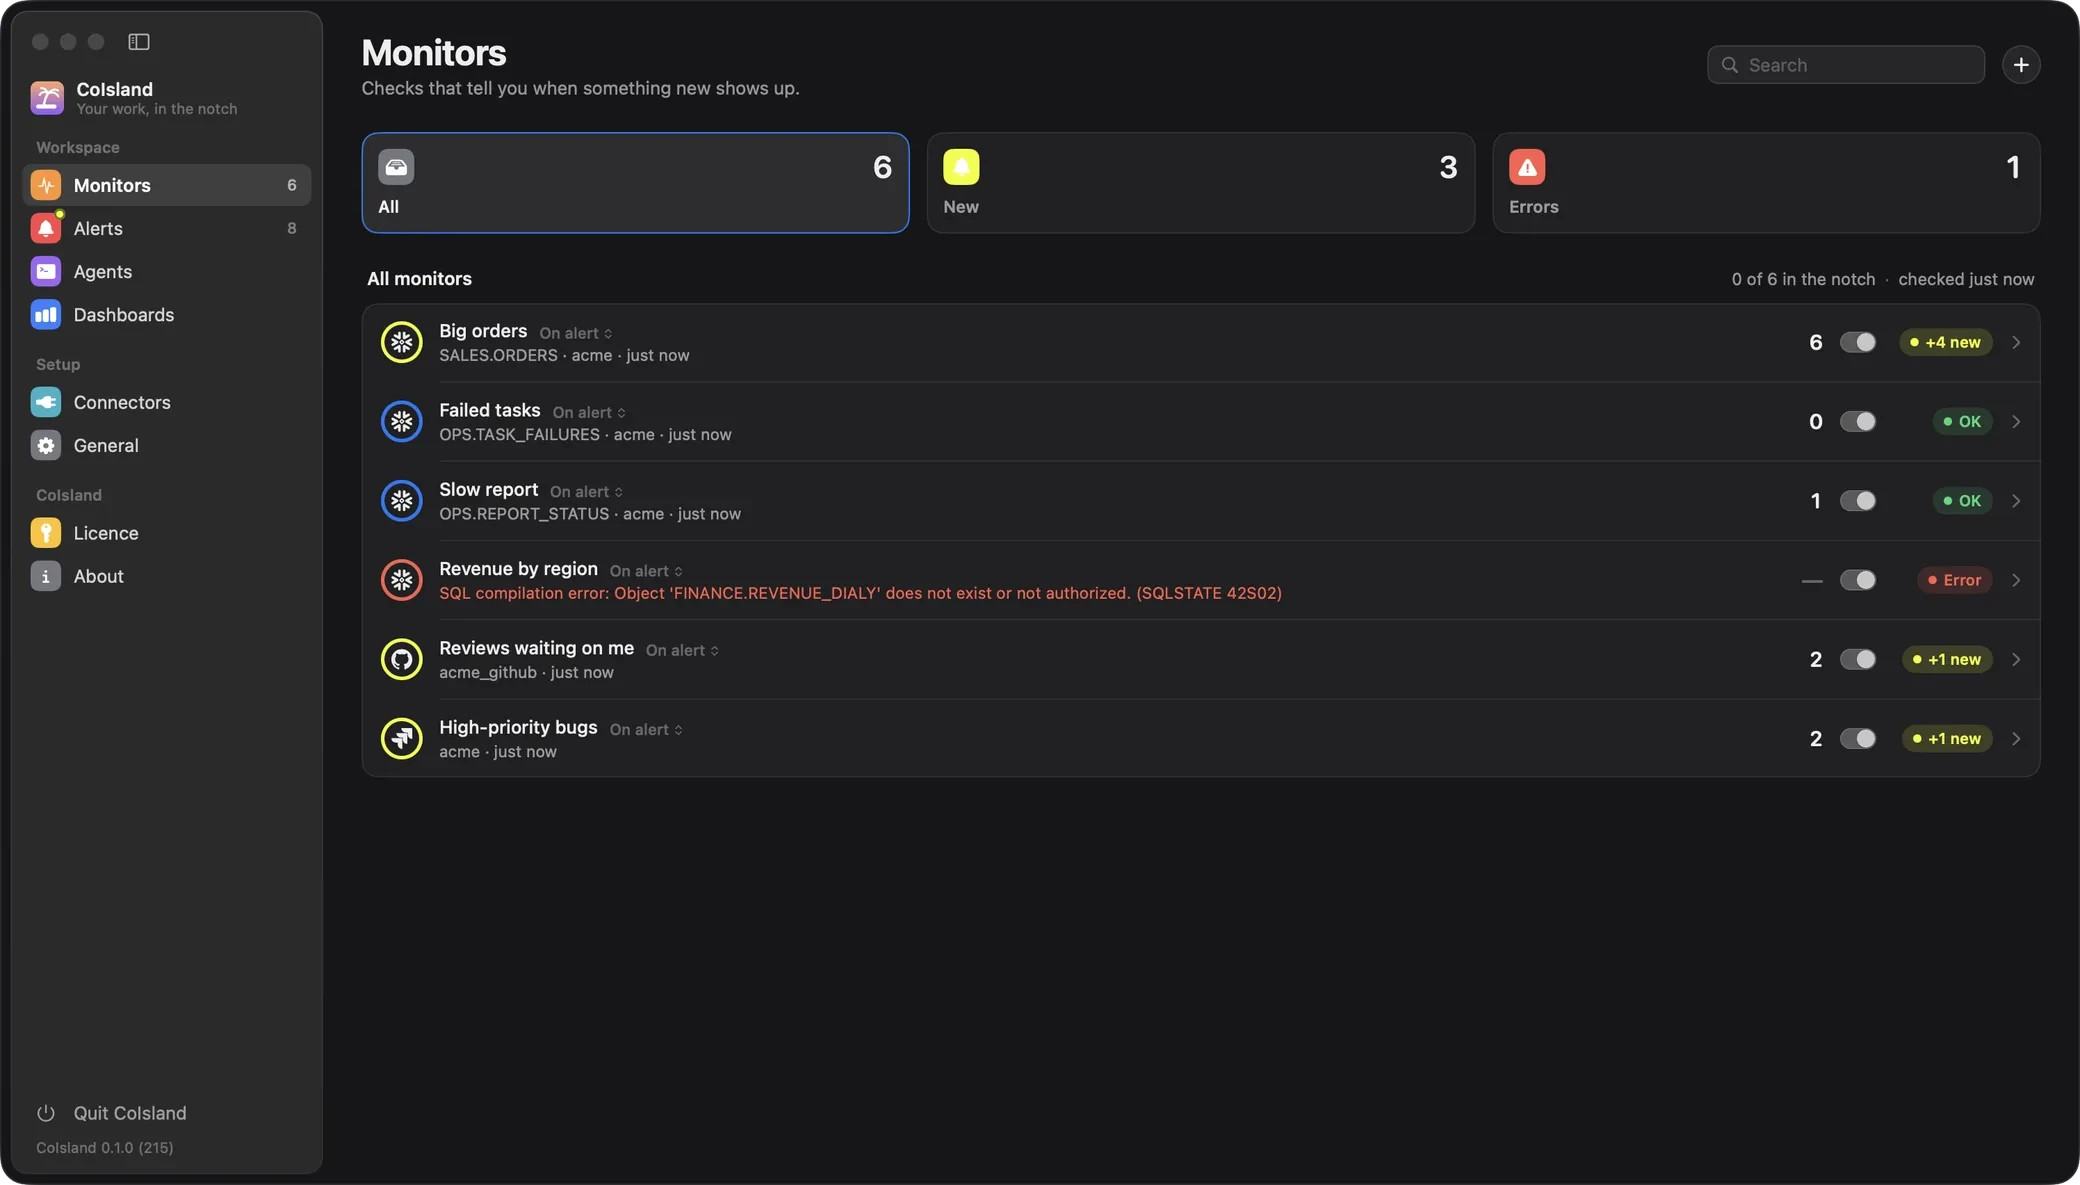
CoIsland has no team account and no server: each person runs it on their own Mac, with their own connectors. What a team shares is its monitors, because each one is a plain text file.
Monitors live in ~/.coisland/watches, one .sql file each: settings in -- key: value comment
lines, then the query. GitHub and Jira monitors add a -- kind: line before their search or JQL.
-- name: Failed tasks
-- connector: analytics
-- database: ANALYTICS
-- every: 5m
-- alert: new-rows
-- key: QUERY_ID
-- title: {NAME} failed: {ERROR_MESSAGE}
SELECT query_id, name, error_message, scheduled_time
FROM TABLE(INFORMATION_SCHEMA.TASK_HISTORY(
    SCHEDULED_TIME_RANGE_START => DATEADD('hour', -1, CURRENT_TIMESTAMP())))
WHERE state = 'FAILED'- Keep the folder in git. Only the visible
.sqlfiles at its top count, so.gitand a README are ignored. A file you pull shows up within a second. - No secret in the file. It names a connector, or none for your default one; each teammate adds that connector with their own token.
- New-rows monitors start quiet. The first check only records what already matches. A count monitor already past its line alerts at once.
- Alerts stay on each Mac, with their notes, agent sessions and dashboards. There is no shared inbox.
Watch files lists every header key.
See which monitors earn their place
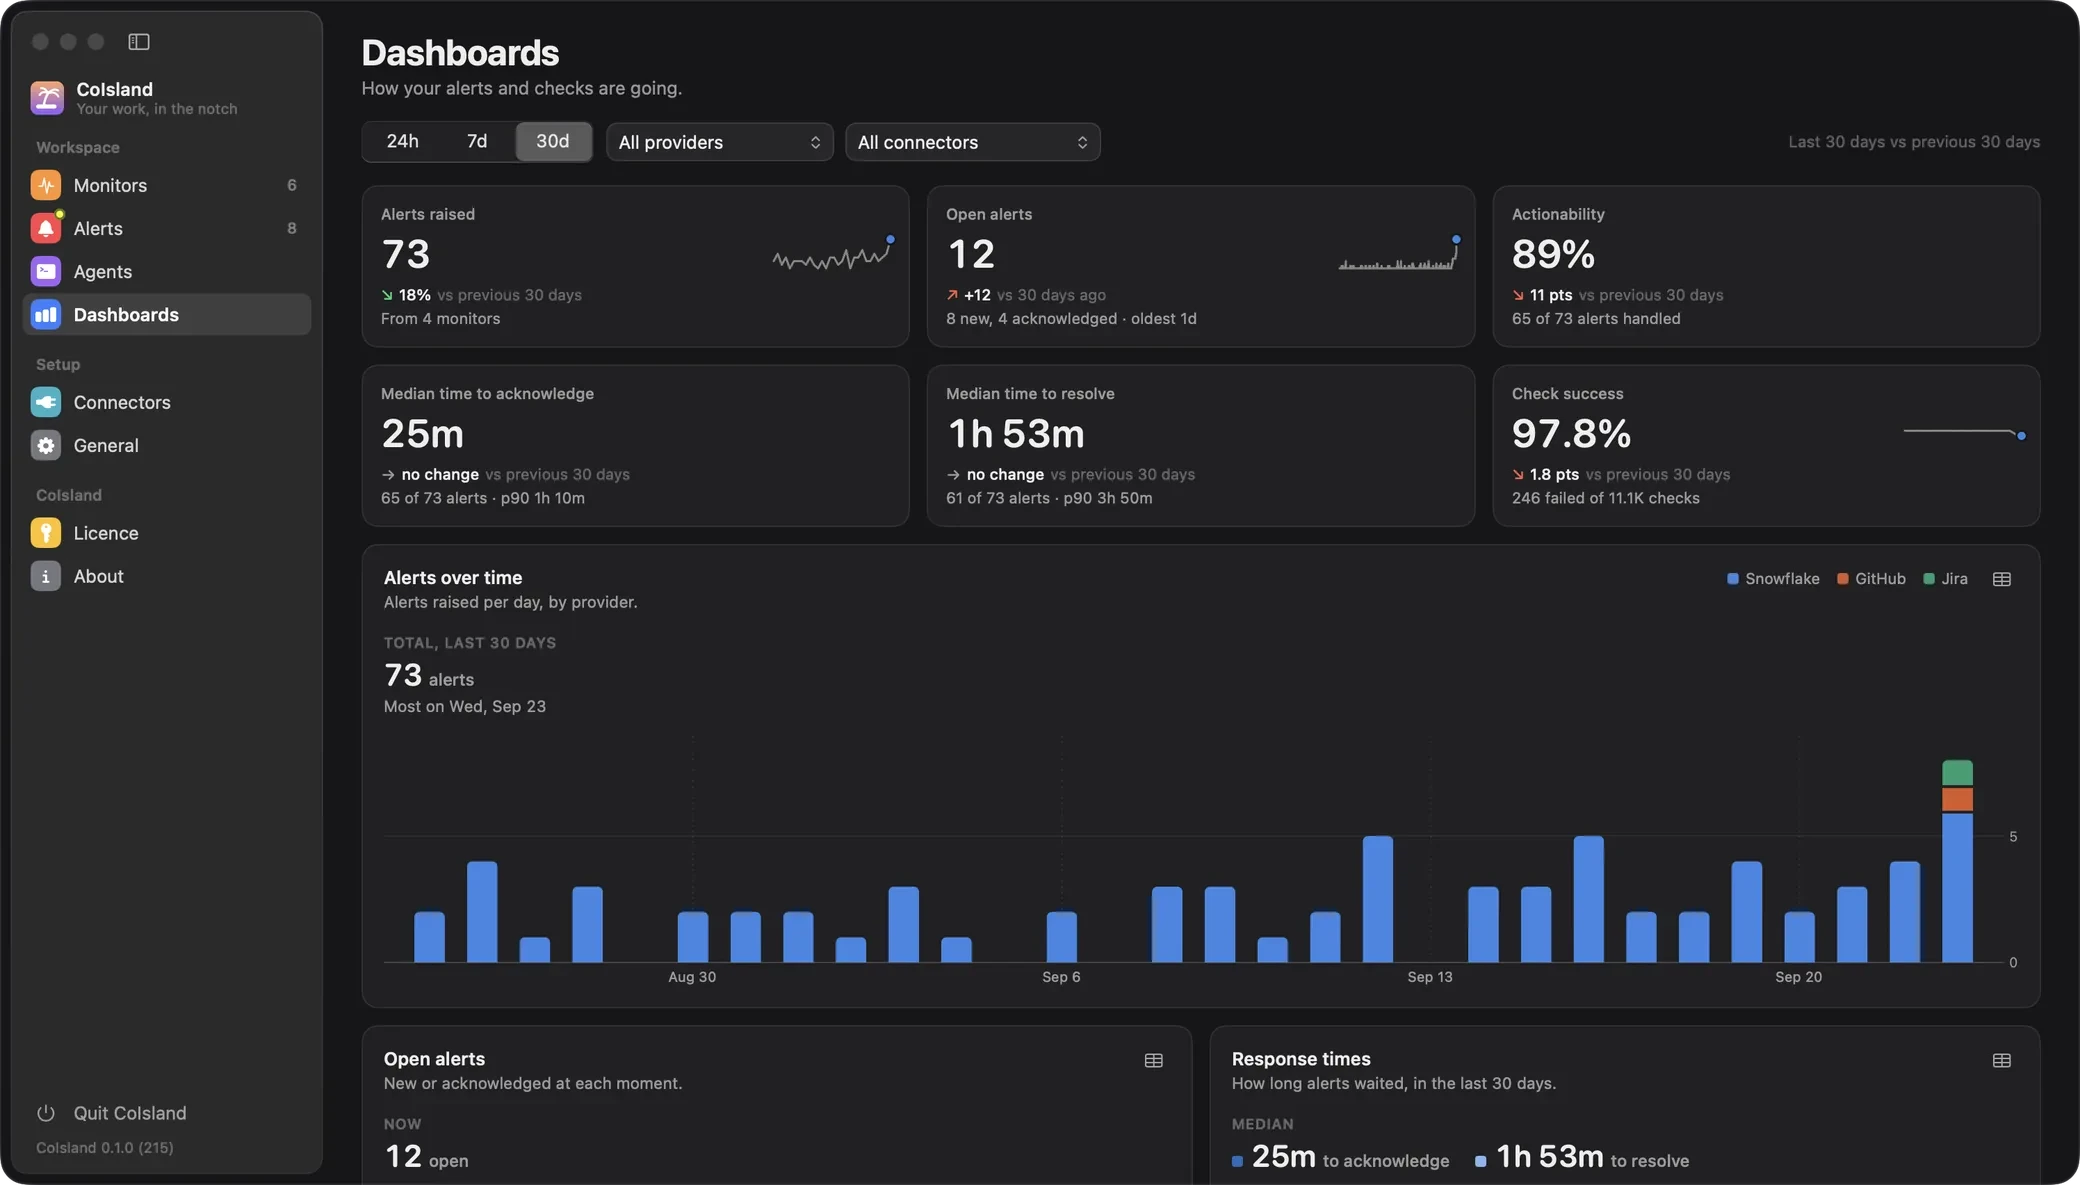
A monitor that alerts all day teaches people to ignore the notch. Dashboards show, over 24 hours, 7 or 30 days, alerts raised and open, the share someone handled (a falling share is alert fatigue), and the median time to acknowledge and to resolve. Filter by connector, then tighten or retire the noisiest monitors.
Support teams are next
A page for support teams is next. Today, the Jira connector's SLAs monitor already watches Jira Service Management requests that breach an SLA, or are about to:
-- name: Breached requests
-- kind: jira.sla
-- every: 5m
project = HELP AND "Time to resolution" = breached()
Each request alerts when it starts matching.
Questions teams ask
Can a whole team use CoIsland?
Yes, one Mac at a time. Each person installs CoIsland and adds their own connectors; a license is $19.99 until October 25, the early bird price, then $59.99, paid once, for up to 2 Macs. There is no team account and no shared server: a team shares its monitors as files, for example in a git repository.
How do I share CoIsland monitors with my team?
Share the files. Every monitor is a .sql file in ~/.coisland/watches, with its settings in comment lines and no secret in it. Keep the folder in git or copy the files; teammates add a connector with the same name, or leave the connector line out to use their default one.
Does CoIsland send our data to a CoIsland server?
No. CoIsland talks only to your tools' own APIs, from your Mac. There is no CoIsland server and no CoIsland account, and your tokens stay on the Mac.
Which AI agents can triage a CoIsland alert?
Claude Code, Codex and Cortex Code. Each runs its own CLI in a terminal under the alert, starts with the whole alert as its first message, and is launched in the mode that asks before it acts. General > AI Agents shows each CLI with its version, path and account.
Does CoIsland work for support teams?
Partly, today: the Jira connector has an SLAs monitor for Jira Service Management requests that breach an SLA or are about to. A page for support teams is next.
Which tools can CoIsland watch?
37 today, each through its own connector: Gmail, Calendar, Dock badges, Apple Mail, GitHub, Vercel, GitLab, Cloudflare, Render, Jira, Linear, Confluence, Asana, ClickUp, Todoist, Notion, Shortcut, Airtable, Reminders, Sentry, PagerDuty, Datadog, New Relic, Langfuse, Snowflake, Databricks, dbt, PostHog, Supabase, PostgreSQL, MySQL, ClickHouse, HTTP / JSON, RSS / Atom, Status pages, Shell command and Stripe. More are on the way. GitHub covers github.com, GitHub Enterprise Server and GHE.com; Jira covers Cloud and Data Center.
Put your work stack in the notch
Regular price: $59.99 Early bird price: $19.99 once, for 2 Macs. Native for Apple Silicon, macOS 14 and later.
Early bird price until October 25