

Snowflake alerts come in more than one shape. Snowflake can check a condition on a schedule and email you, a task can report its own errors to a cloud queue, and a data metric function can flag a broken table. This guide sets up each one with SQL you can run, compares where each alert lands and what it costs, then shows a fourth way: a read-only query checked from your Mac, with the failed rows in your island and an AI agent one click away.
What should trigger a Snowflake alert
- A task that fails. The
TASK_HISTORYtable function returns the runs of the last seven days, a failed one withSTATE = 'FAILED'and itsERROR_MESSAGE. - Rows that break a rule. Duplicates, nulls where there should be none, amounts out of range, data that stopped arriving.
- A number that crosses a line. Orders per hour, credits per day, rows loaded by a pipeline.
Each of these is a query that returns rows when something is wrong. Every way below works the same: you write that query, and something runs it for you and tells you when it returns rows.
Way 1: Snowflake alerts with CREATE ALERT and email
A Snowflake alert is a schema-level object with three parts: a condition in SQL, an action to run when the condition returns rows, and a schedule.
Create an email notification integration
CREATE NOTIFICATION INTEGRATION data_alerts_email
  TYPE = EMAIL
  ENABLED = TRUE
  ALLOWED_RECIPIENTS = ('oncall@example.com');
Emails go only to users of the same Snowflake account whose email address is verified. Creating the integration takes the global CREATE INTEGRATION or CREATE NOTIFICATION INTEGRATION privilege.
Write the alert
This one looks for task runs that failed since its last successful check:
CREATE OR REPLACE ALERT failed_tasks_alert
  WAREHOUSE = monitor_wh
  SCHEDULE = '10 MINUTE'
  IF (EXISTS (
    SELECT name, error_message
    FROM TABLE(ANALYTICS.INFORMATION_SCHEMA.TASK_HISTORY(
      SCHEDULED_TIME_RANGE_START => DATEADD('hour', -1, CURRENT_TIMESTAMP()),
      ERROR_ONLY => TRUE))
    WHERE state = 'FAILED'
      AND completed_time BETWEEN SNOWFLAKE.ALERT.LAST_SUCCESSFUL_SCHEDULED_TIME()
                             AND SNOWFLAKE.ALERT.SCHEDULED_TIME()
  ))
  THEN
    CALL SYSTEM$SEND_EMAIL(
      'data_alerts_email',
      'oncall@example.com',
      'Snowflake task failed',
'A task failed in the last 10 minutes. See TASK_HISTORY for the error.');- Schedule. A number of minutes, or
USING CRONwith a time zone. LeaveSCHEDULEout and you get an alert on new data, which checks only the new rows of one table that has change tracking on. - Compute. With
WAREHOUSE, the check runs on that warehouse. Without it, the alert is serverless, which also takes theEXECUTE MANAGED ALERTprivilege. - Condition. A
SELECT,SHOWorCALL. The window between the twoSNOWFLAKE.ALERTfunctions makes each failure count once.
Turn it on and check that it ran
ALTER ALERT failed_tasks_alert RESUME;

SELECT *
FROM TABLE(INFORMATION_SCHEMA.ALERT_HISTORY(
  SCHEDULED_TIME_RANGE_START => DATEADD('hour', -1, CURRENT_TIMESTAMP())))
ORDER BY scheduled_time DESC;
A new alert is suspended until you resume it. The role that owns it needs EXECUTE ALERT on the account, which only ACCOUNTADMIN can grant. The email says that a task failed, not which one: to put the task names in it, the action has to read the condition’s rows back with RESULT_SCAN and the query ID that GET_CONDITION_QUERY_UUID() returns.
Way 2: Snowflake task failure notifications
A task can report its own failures. Set ERROR_INTEGRATION on the root task of a task graph, and a failed run of any task in it sends a JSON message with the task’s name and its errors:
ALTER TASK nightly_load SET ERROR_INTEGRATION = task_errors_sns;The integration must be a cloud queue: Amazon SNS, Azure Event Grid or Google Pub/Sub. Email and webhook integrations are not supported for task errors, so something on your side, a pager or a function, has to read the queue. Delivery is at least once, so the same failure can arrive twice.
Without any integration, you can still ask Snowflake which runs failed:
SELECT name, error_code, error_message, scheduled_time
FROM TABLE(ANALYTICS.INFORMATION_SCHEMA.TASK_HISTORY(
  SCHEDULED_TIME_RANGE_START => DATEADD('day', -1, CURRENT_TIMESTAMP()),
  RESULT_LIMIT => 1000,
  ERROR_ONLY => TRUE))
WHERE state = 'FAILED'
ORDER BY scheduled_time DESC;
ERROR_ONLY keeps failed and cancelled runs. RESULT_LIMIT defaults to 100 rows and goes up to 10,000. Your role sees the runs of the tasks it owns, monitors or operates, or every run with the MONITOR EXECUTION privilege.
Way 3: Chat webhooks and data quality alerts
Send an alert to Slack, Teams or PagerDuty
A webhook notification integration posts to Slack, Microsoft Teams, PagerDuty, Jira or ServiceNow, with the webhook’s secret kept in a Snowflake secret. Put this call in the alert’s action in place of SYSTEM$SEND_EMAIL:
CALL SYSTEM$SEND_SNOWFLAKE_NOTIFICATION(
  SNOWFLAKE.NOTIFICATION.TEXT_PLAIN(
    SNOWFLAKE.NOTIFICATION.SANITIZE_WEBHOOK_CONTENT('A Snowflake task failed.')),
  SNOWFLAKE.NOTIFICATION.INTEGRATION('my_slack_webhook_int'));
Snowflake data quality alerts with data metric functions
Data metric functions (Enterprise Edition) measure a table on a schedule: NULL_COUNT, DUPLICATE_COUNT, FRESHNESS, ROW_COUNT and your own.
ALTER TABLE sales.customers SET DATA_METRIC_SCHEDULE = 'TRIGGER_ON_CHANGES';

ALTER TABLE sales.customers
  ADD DATA METRIC FUNCTION SNOWFLAKE.CORE.NULL_COUNT ON (email);
Results land in the DATA_QUALITY_MONITORING_RESULTS view of SNOWFLAKE.LOCAL, which takes the DATA_QUALITY_MONITORING_VIEWER application role to read. You can give a metric an expectation, such as VALUE = 0, and turn on notifications for a whole database, to email or a webhook integration. The compute is serverless and billed as Data Quality Monitoring.
Where each alert lands, who owns it, what it costs
| Way | Where you hear | Who sets it up | Runs | Cost |
|---|---|---|---|---|
CREATE ALERT and email |
The inbox of verified users of the account | A role with EXECUTE ALERT, granted by ACCOUNTADMIN, and one that can create integrations |
In the account, around the clock | Warehouse credits or serverless compute per check |
Task ERROR_INTEGRATION |
SNS, Event Grid or Pub/Sub, then whatever reads it | The task owner, with USAGE on the integration |
On each failed run | Your cloud queue service |
| Webhook integration | Slack, Teams, PagerDuty, Jira or ServiceNow | A role that can create integrations, plus a secret | Where the alert runs | As for the alert |
| Data metric functions | A results view, email or webhook | The table owner, on Enterprise Edition | On the table’s schedule or its changes | Serverless, billed as Data Quality Monitoring |
| CoIsland monitor | An island on your Mac, with the rows | You, with a read-only query | On your Mac, while it is on | Warehouse time per check; the app is a one-time license |
The native routes have one big strength: they live in the account and keep running when every laptop is closed. They also stop at the same place. The message is a line in an inbox or a channel, not the rows, and each one needs privileges an analyst often does not have. For the alerts you act on yourself, the last way puts the rows in front of you.
Way 4: Snowflake alerts in an island on your Mac
CoIsland is a Mac app (Apple Silicon, macOS 14 or later) that watches your work stack through connectors, Snowflake among them. It runs your query from your Mac on the schedule you set, and what changed reaches the island as an alert. It talks only to Snowflake’s own API: there is no CoIsland server and no CoIsland account, and your token stays on your Mac.
1. Add a Snowflake connector
In Settings › Connectors, add Snowflake with your account, user, a programmatic access token, one role and a warehouse. Or import a connection from ~/.snowflake, the file the Snowflake CLI and Cortex Code already read, when it signs in with a programmatic access token: CoIsland copies it in and never writes to that file. Connect Snowflake walks through every field.
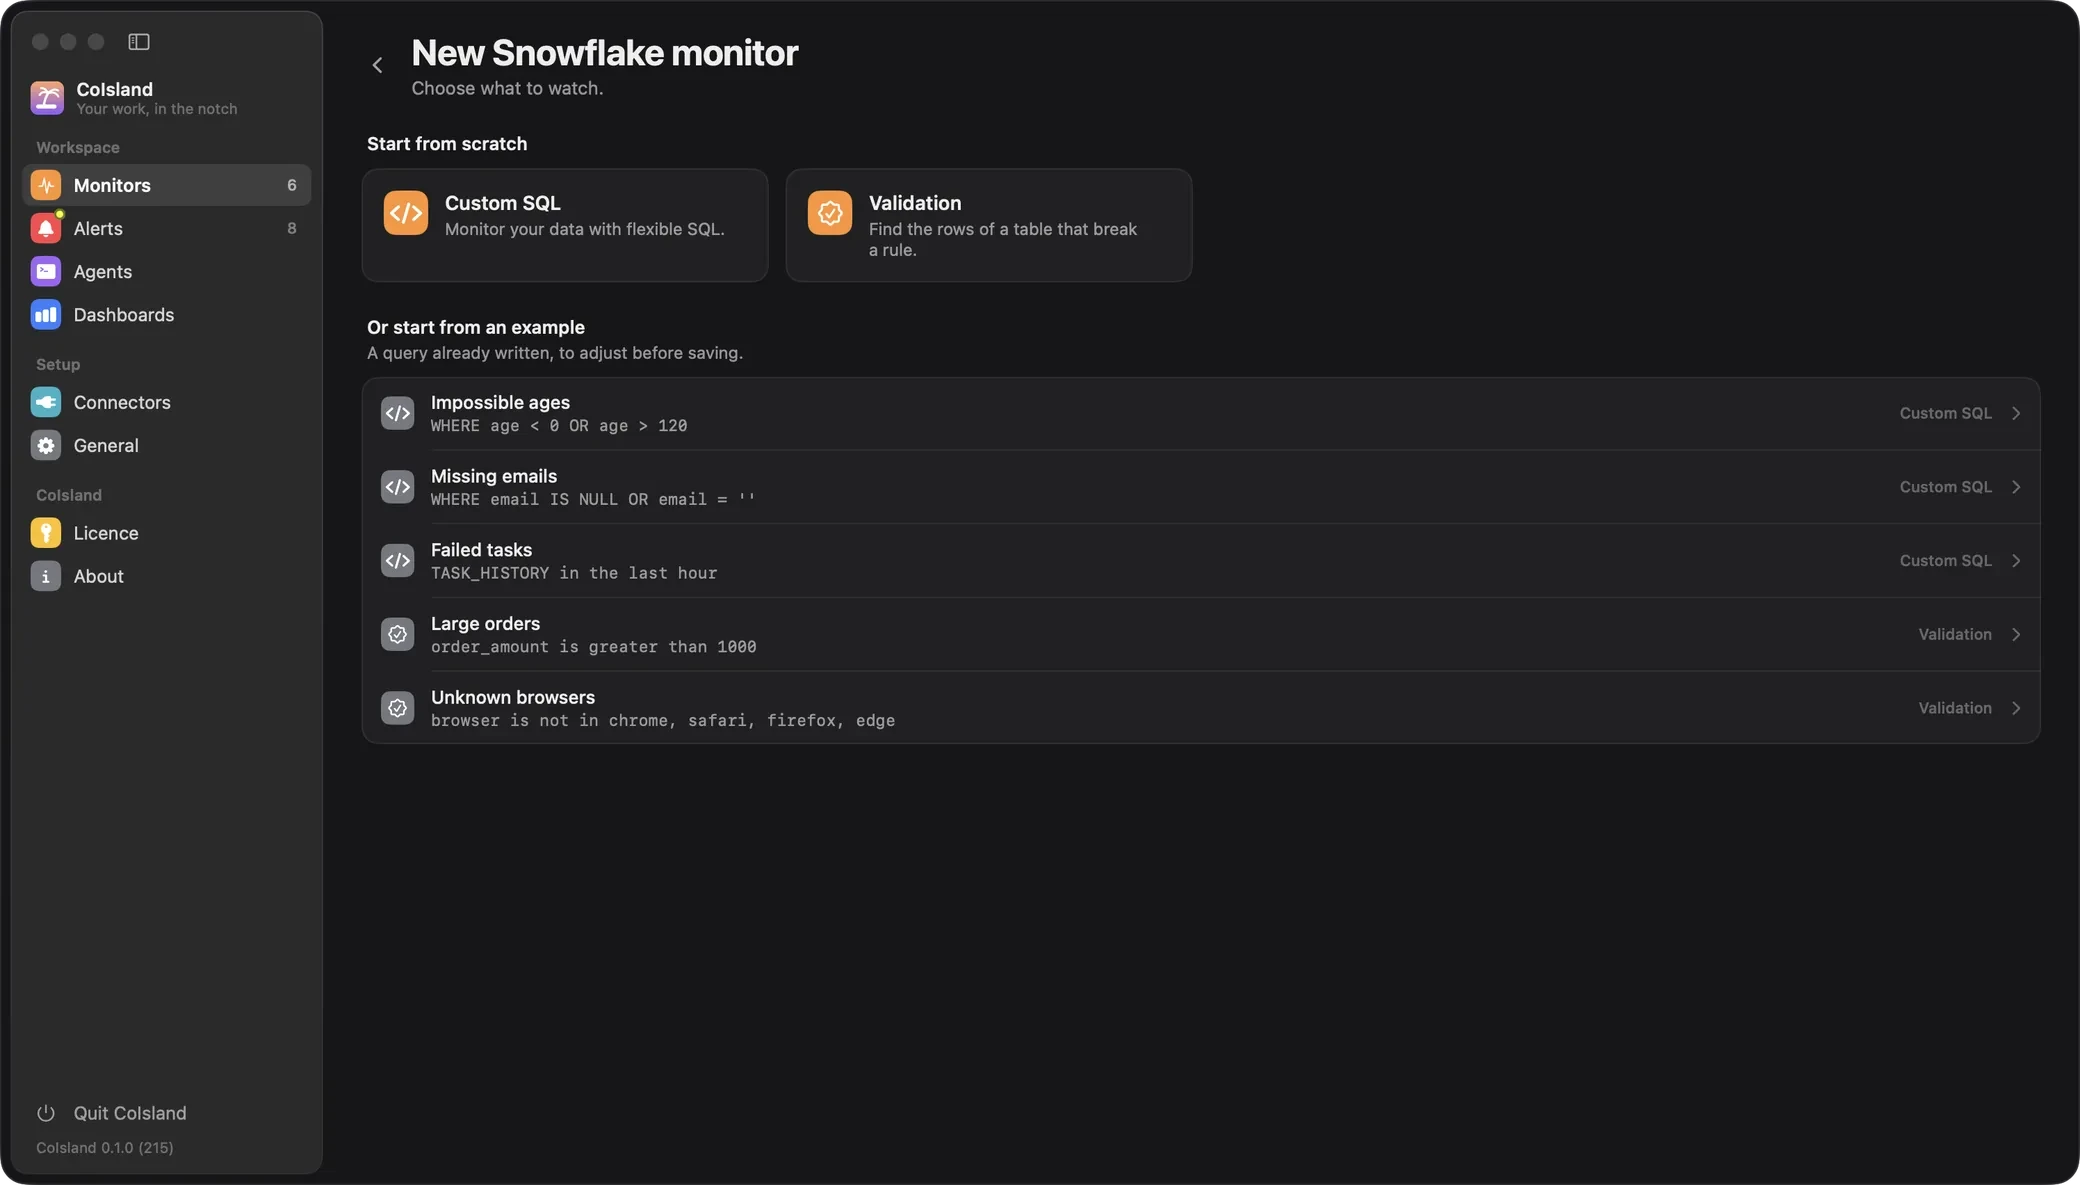
2. Start from the Failed tasks example
In Settings › Monitors, add a Snowflake monitor. Custom SQL watches the rows of any read-only query. Validation writes the SQL for one rule on one column, such as a null email or an amount over 1000, which covers the simplest Snowflake data quality alerts.

3. Or write it as a watch file
Every monitor, of every connector, is a .sql file in ~/.coisland/watches, and a file with no kind line is Snowflake SQL. CoIsland picks up a file as soon as you save it. Here is the complete failed-task monitor, saved as failed-tasks.sql:
-- name: Failed tasks
-- connector: acme
-- every: 5m
-- alert: new-rows
-- key: QUERY_ID
-- title: {NAME} failed: {ERROR_MESSAGE}
-- icon: exclamationmark.triangle
-- Task runs that failed in the last hour, one alert per run.
SELECT query_id, database_name, schema_name, name, error_message, scheduled_time
FROM TABLE(ANALYTICS.INFORMATION_SCHEMA.TASK_HISTORY(
    SCHEDULED_TIME_RANGE_START => DATEADD('hour', -1, CURRENT_TIMESTAMP()),
    RESULT_LIMIT => 1000,
    ERROR_ONLY => TRUE))
WHERE state = 'FAILED'connectornames the Snowflake connector that runs it.everytakes seconds, minutes or hours, from30sto 30 days; without it, 15 minutes.alert: new-rowsfires for each row whose key was not there at the last check;count > 0would instead fire once, when the count crosses the line.key: QUERY_IDmakes each failed run its own row, even when two runs fail with the same error.titleis how each row reads in the island, built from its columns.
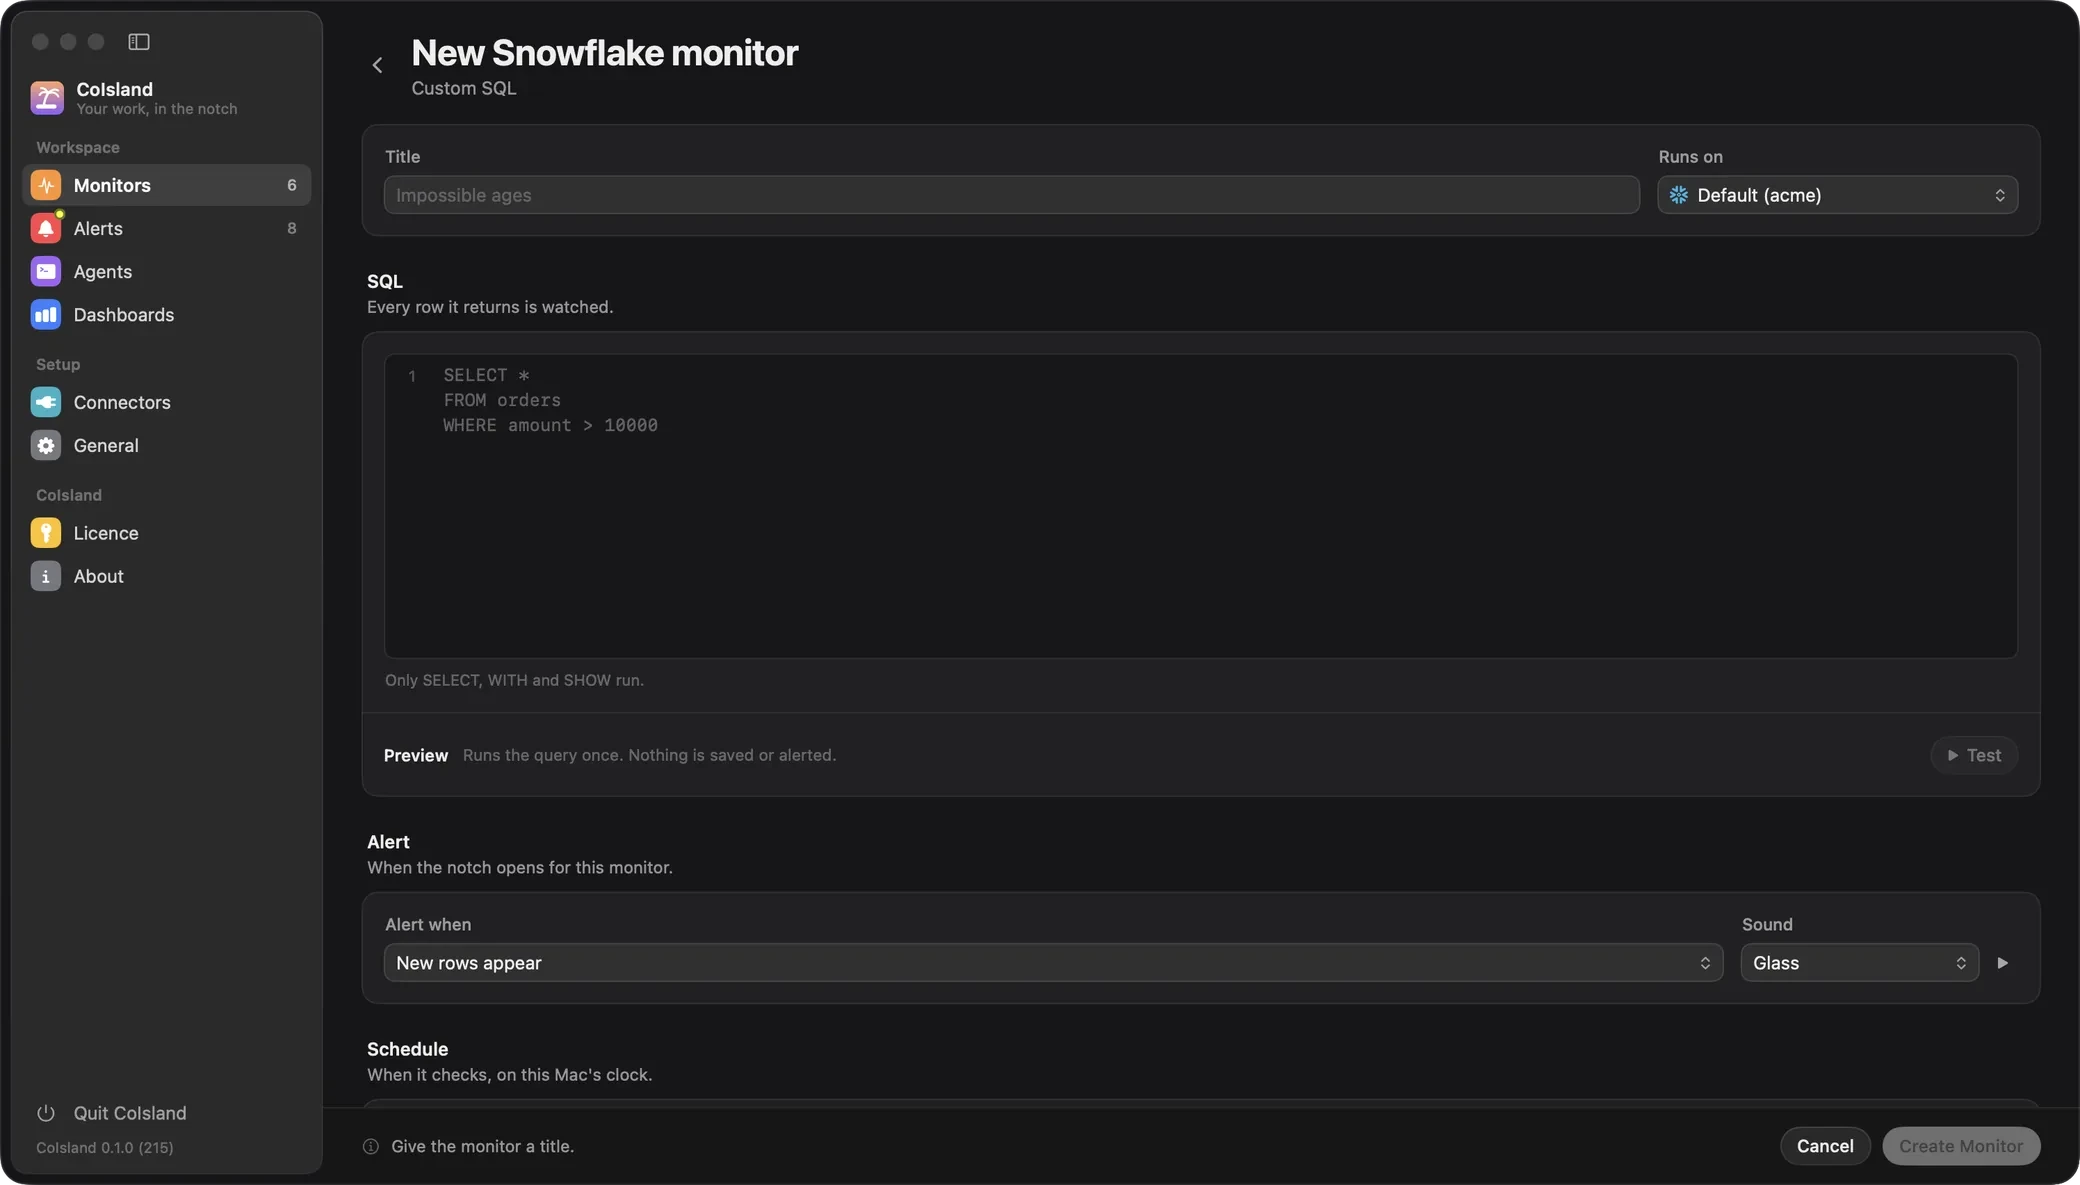
Comments are valid SQL, so the whole file is what runs, and the query must start with SELECT, WITH or SHOW. Watch files lists every header key. In the app, the same settings are the fields of the Custom SQL editor:
4. What you see when a task fails
The first check records what already matches and fires nothing. After that, each failed run that was not there at the last check is new: the island opens for a few seconds with a sound, the monitor’s ring shows +1, and its card lists the new row first, as nightly_load failed: followed by the error.
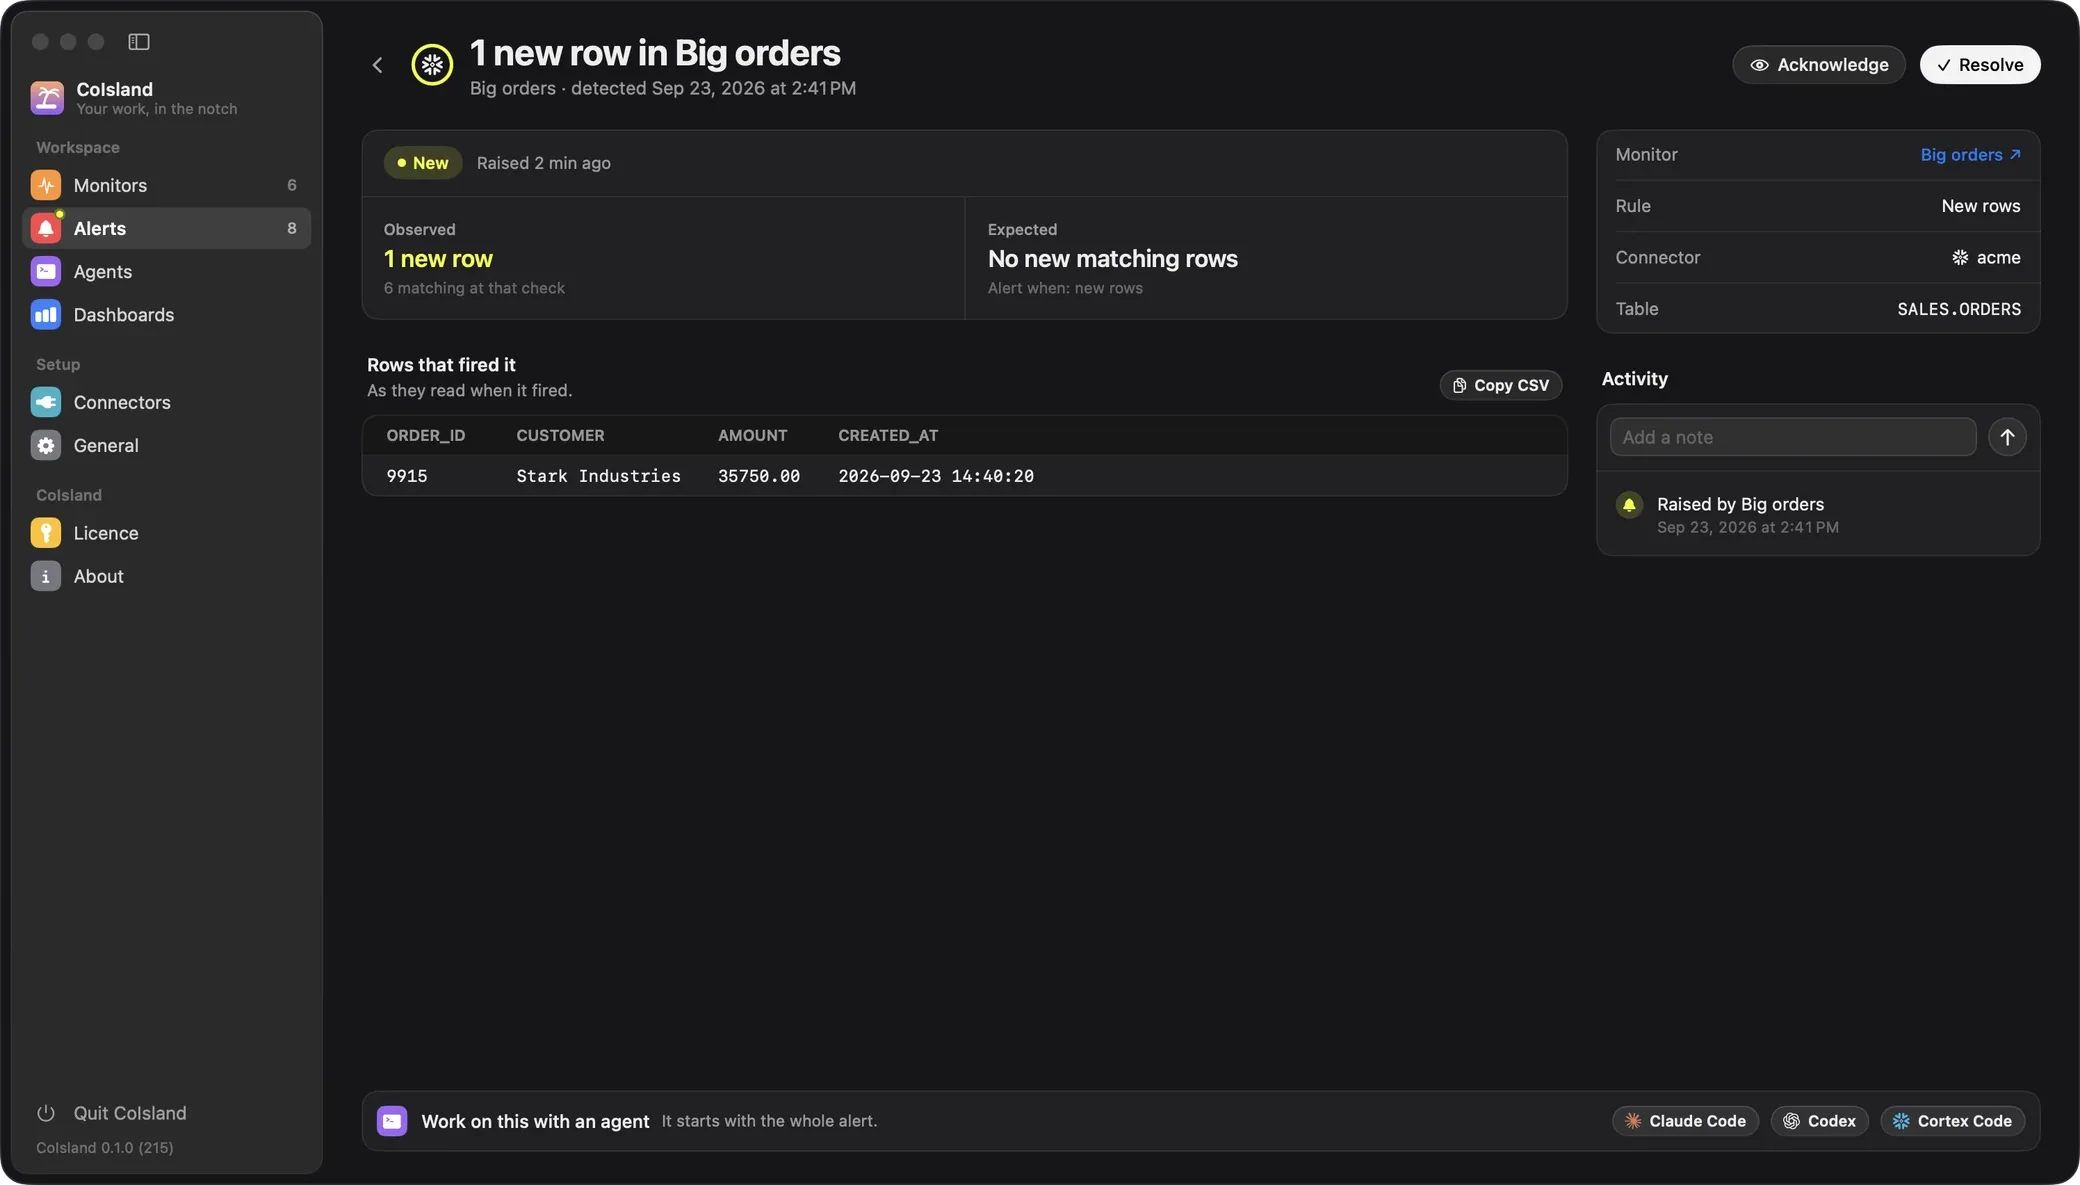
Click the ring to open the alert. It shows what the monitor expected, what it observed and when, the rows that fired it as they read then, and an activity log for notes. Acknowledge it when you are on it and resolve it when it is fixed; the 500 newest alerts are kept.
Hand the Snowflake alert to Cortex Code or Claude Code
At the bottom of the alert, and of the monitor’s card in the island, are Claude Code, Codex and Cortex Code. A click starts that agent’s own CLI in a terminal under the alert. Its first message is the whole alert: the facts, the query, the rows and the activity.
Claude Code and Codex start in their auto modes, Cortex Code with its default approvals: each checks what it can, fixes what is safe and asks you before anything destructive. It never resolves the alert: you do. Cortex Code runs on its own ~/.snowflake connections, the ones CoIsland imported yours from, so a follow-up query about the failed task runs on the same account.
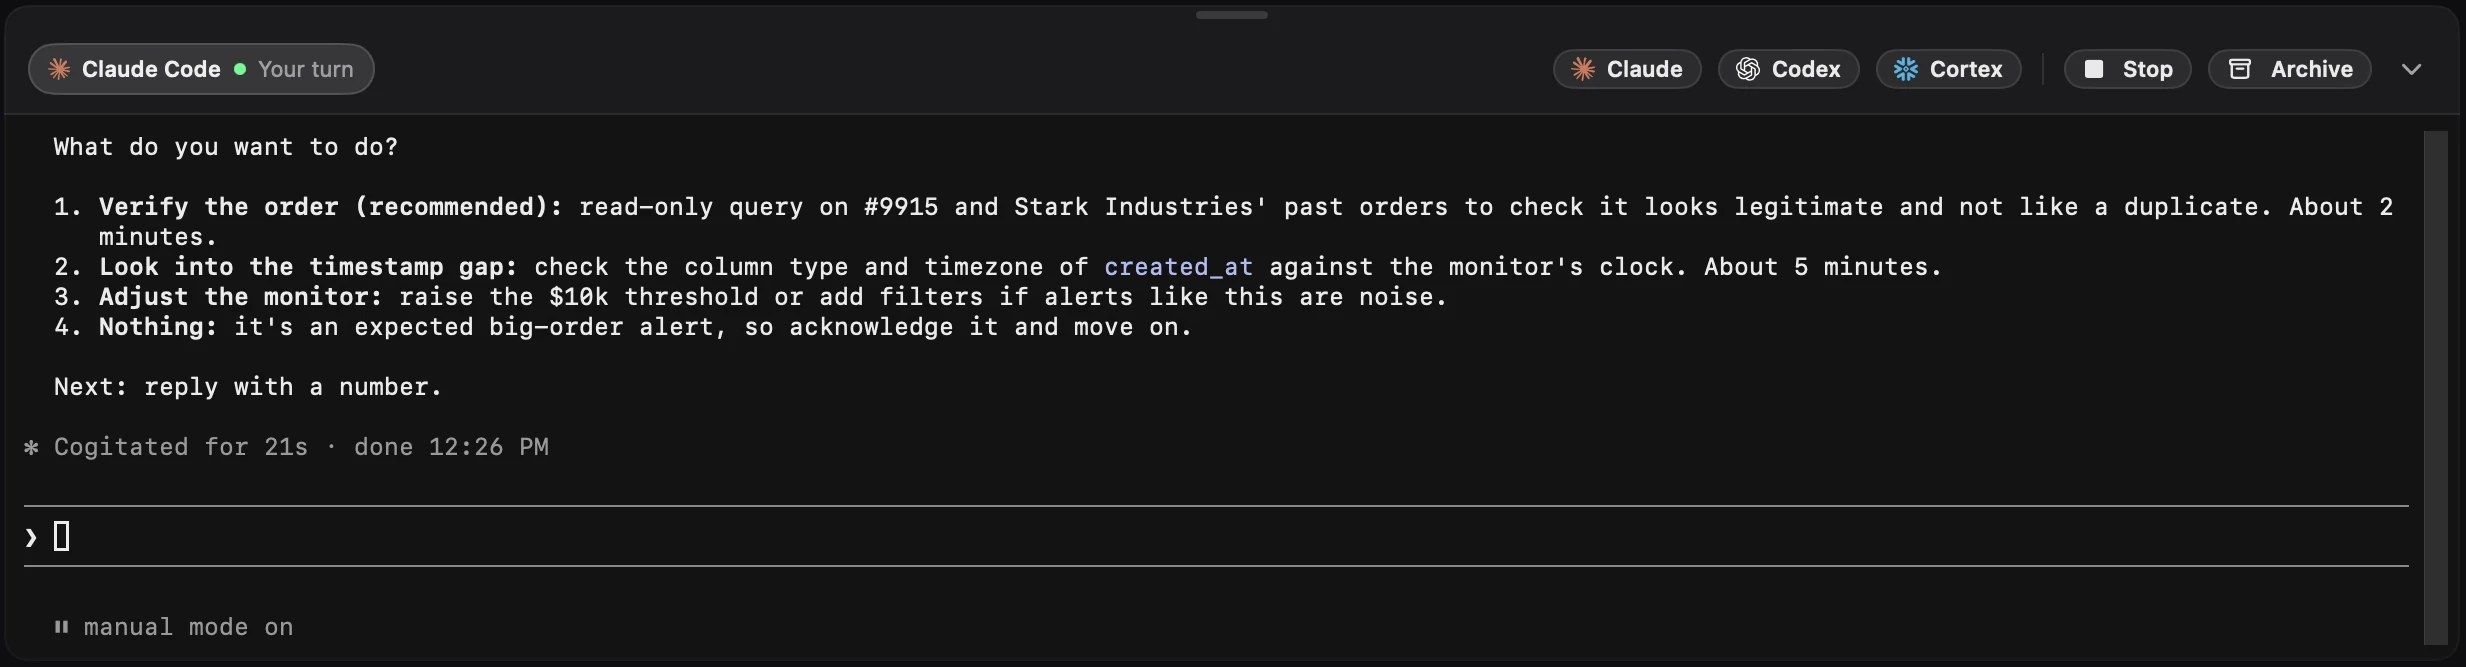
Settings › Agents lists every session, to open again, resume, stop or archive. Agents covers how each one is launched.
Which way to choose
- Something must page on-call at night: a Snowflake alert, or a task
ERROR_INTEGRATIONinto the pager you already have. - A table’s quality is owned by its team: data metric functions, if you have Enterprise Edition.
- You act on it yourself, during the day: a CoIsland monitor, with the rows in the island and an agent to start the investigation.
You can keep both: a Snowflake alerts alternative compares them side by side. The Snowflake connector lists what CoIsland watches in Snowflake, CoIsland for data teams adds GitHub and Jira to the same island, and all guides cover the other connectors.