Getting started
From the download to your first alert in the island, in five steps.
What you need
- A Mac with Apple Silicon (M1 or later) on macOS 14 or later. CoIsland does not run on Intel Macs.
- Nothing to buy to start. CoIsland Community monitors all your agents, plus 2 monitors on your dev tools, for good, with no card and no account; Lifetime runs all of them, paid once, refundable within 30 days.
- An account on one tool you want to watch. Its guide says which token to create.
On this page
Install CoIsland
- Download CoIsland, open the disk image and drag CoIsland into Applications.
- Open it. No window opens and no icon joins the Dock: CoIsland lives in two places.
- The menu bar icon, an island with its palm tree: Settings…, Check All Now, Acknowledge All, Open Watches Folder and Quit CoIsland.
- The island, a small pill on the right edge of your screen that opens when the pointer reaches it. Its gear opens Settings too.
The first time, a short welcome shows you around: where the island lives, which edge it hangs from, your licence and your first tool. Then a tour has you open the island, create a demo monitor, and work its alert: acknowledge it, add a note, hand it to an agent (a replay, no AI runs) and resolve it. The demo leaves nothing behind. CoIsland also creates ~/.coisland/watches, where it saves every monitor as a .sql file.
Add your licence, when you want every monitor
CoIsland Community needs no licence. To run every monitor:
- Buy Lifetime. Your key shows on the next page, and in the email from licences@coisland.app.
- Paste it in the welcome’s licence step, or in Settings › Licence, and click Activate.
Without a key, CoIsland Community runs the 2 monitors you created first; a key runs all of them. One key covers 2 Macs, with every update, for good.
Add a connector
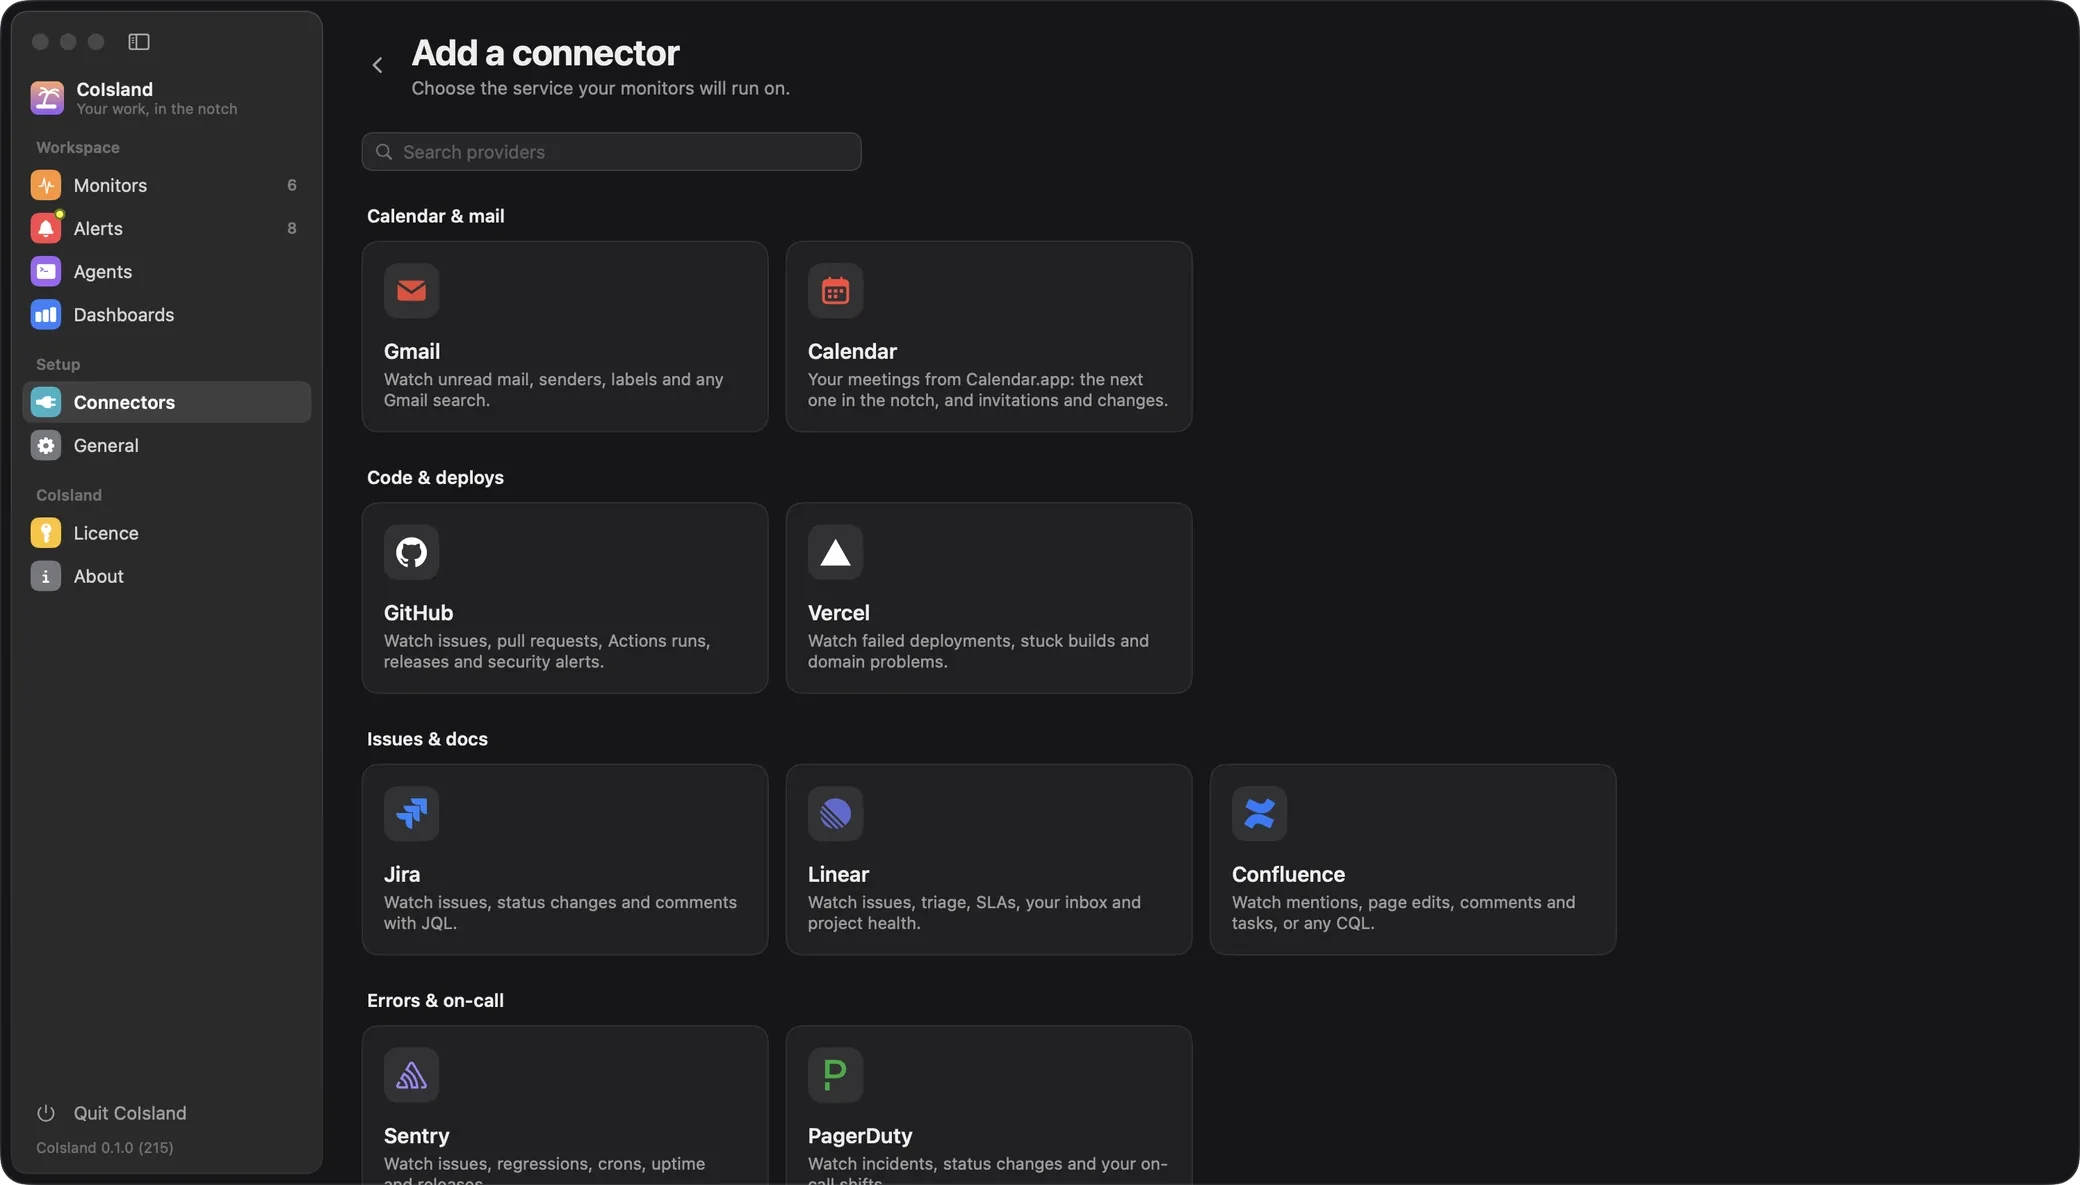
A connector is one account on one tool: the account your monitors run on.
- Open Settings › Connectors and click Add Connector (the + in the corner once you have one).
- Pick the tool and fill in its form. Every field has a hint, and Connector name, the name your monitors use, fills itself in.
- Click Test connector. It signs in and saves nothing: Connected shows the account it found, Failed the reason. Then click Add Connector.
Each tool’s guide says which token to create and where:

Already use the Snowflake CLI or Cortex Code? On its first start, CoIsland imports the connections in their
connections.tomlthat sign in with a programmatic access token, under the same names. Later, Import from Snowflake CLI in the Snowflake form fills it from one. CoIsland only reads that file.
Create a monitor
A monitor asks one tool one question on a schedule.
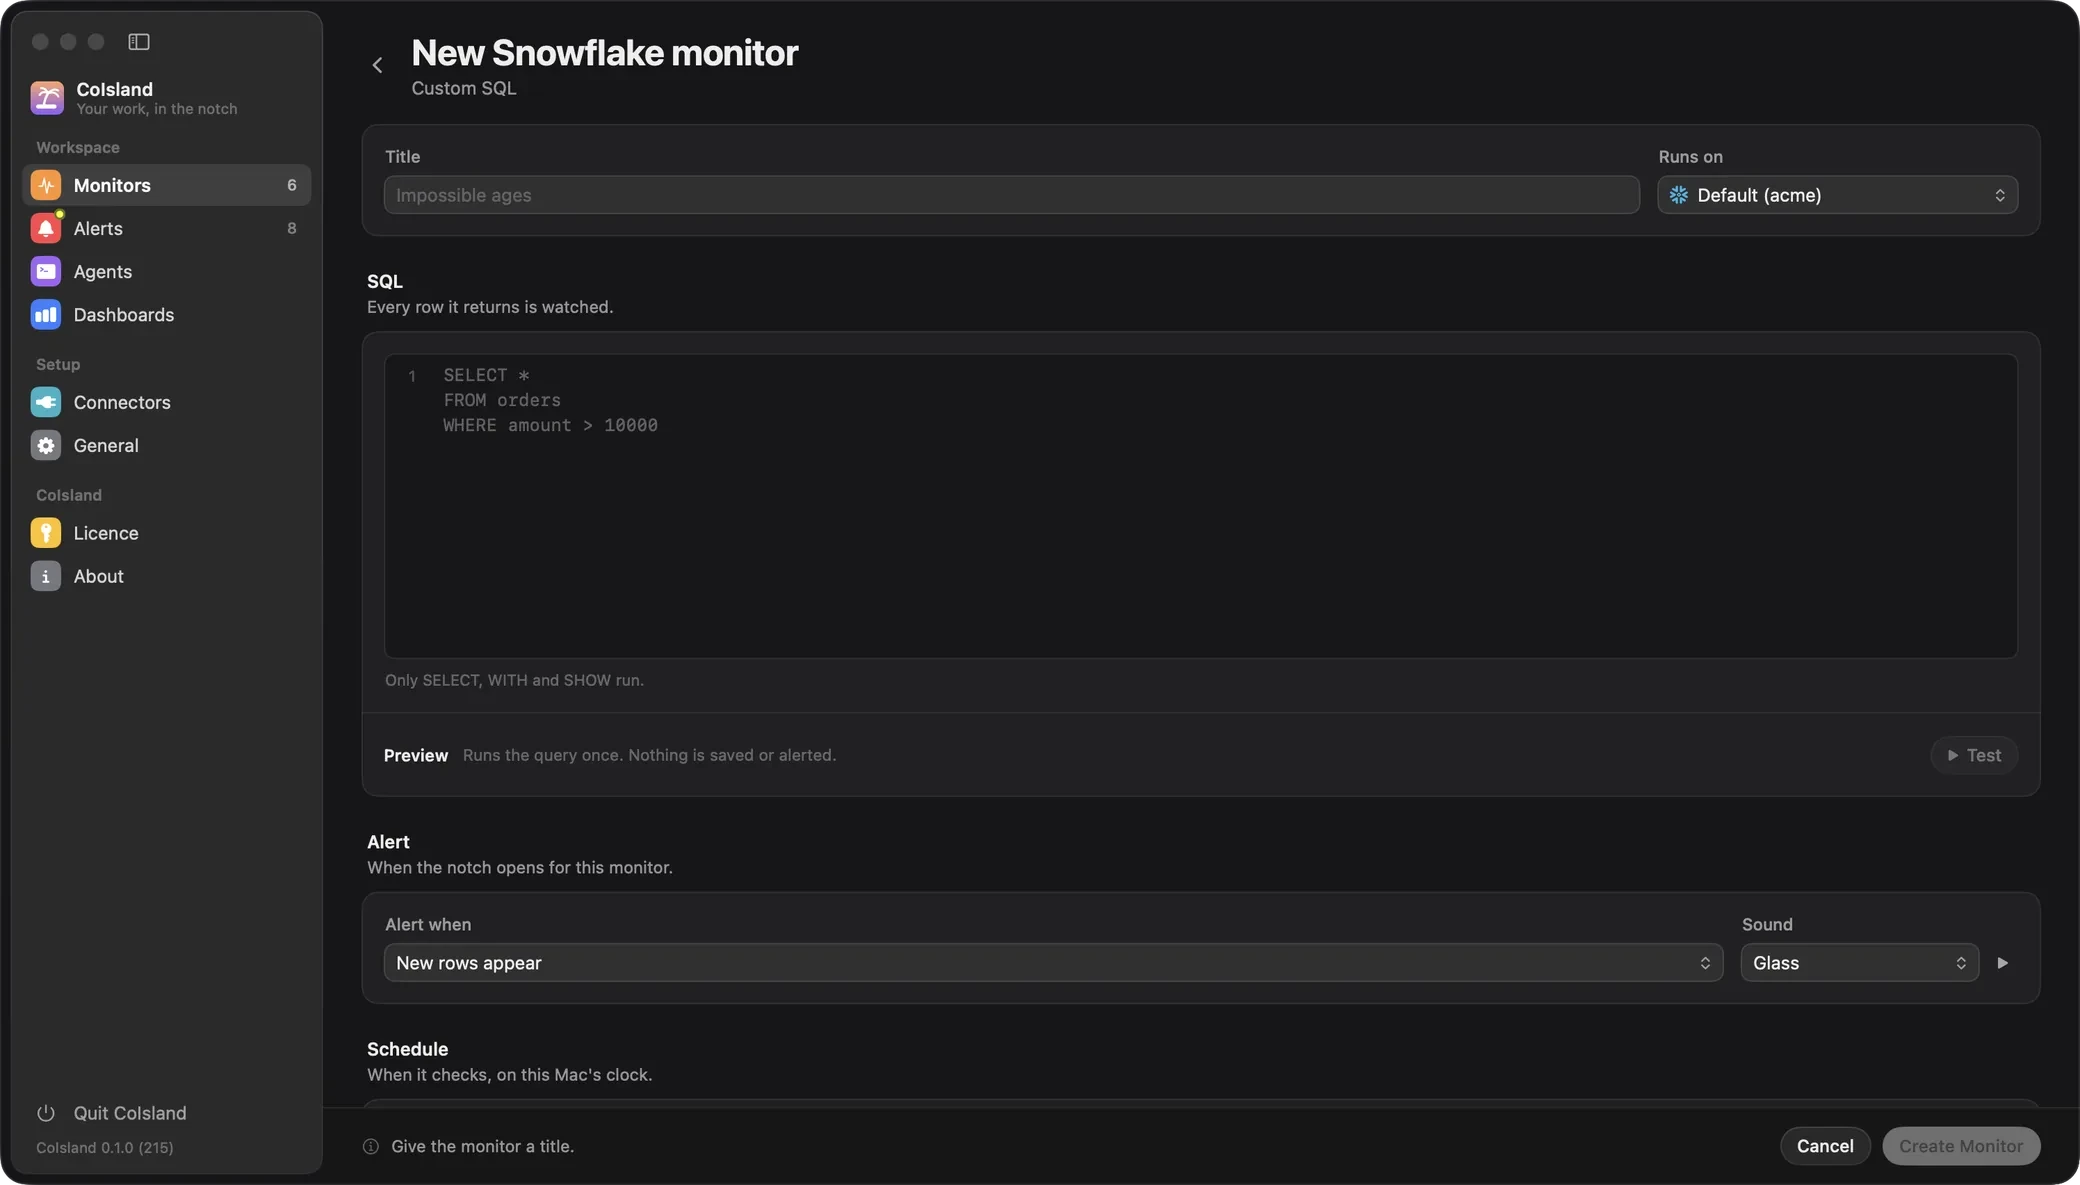
- Open Settings › Monitors, click Add Monitor (the + in the header once you have monitors) and choose where it runs. A tool without a connector says Add a connector first and opens its form.
- Pick one of the tool’s monitor types, or a ready-made one under Or start from an example, which fills in the title and the query.
- Check Title and Runs on (Default is the tool’s default connector), then click Test: it runs once and says how much matches now, such as “2 rows match now”. Nothing is saved or alerted.
- Choose Alert when: New rows appear (on GitHub or Jira, issues, review requests and so on), or a count crosses a threshold such as
count > 0. - Choose Check every (15 minutes by default, up to 30 days) and a Sound (None keeps it silent), then click Create Monitor.
| Connector | A good first example (type) | It starts from |
|---|---|---|
| Snowflake | Failed tasks (Custom SQL) | Task runs that failed in the last hour |
| GitHub | Reviews waiting on me (Review requests) | user-review-requested:@me is:open -is:draft |
| Jira | Assigned to me (Issues) | assignee = currentUser() AND statusCategory != Done |
The first check runs at once and, with New rows appear, only records what already matches: those rows never alert, and every row that starts matching later does. A threshold has no quiet first check: it fires once when it becomes true, and again only after it has cleared.
The Snowflake example, in SQL
SELECT query_id, name, error_message, scheduled_time
FROM TABLE(INFORMATION_SCHEMA.TASK_HISTORY(
    SCHEDULED_TIME_RANGE_START => DATEADD('hour', -1, CURRENT_TIMESTAMP())))
WHERE state = 'FAILED'
INFORMATION_SCHEMA lives in a database, so this query needs one: if your connector has no default database, open Advanced at the bottom of the form and fill in Database. Snowflake monitors only run statements that start with SELECT, WITH or SHOW.
Every monitor is saved as a .sql file you can also edit by hand: see Watch files.
See it in the island
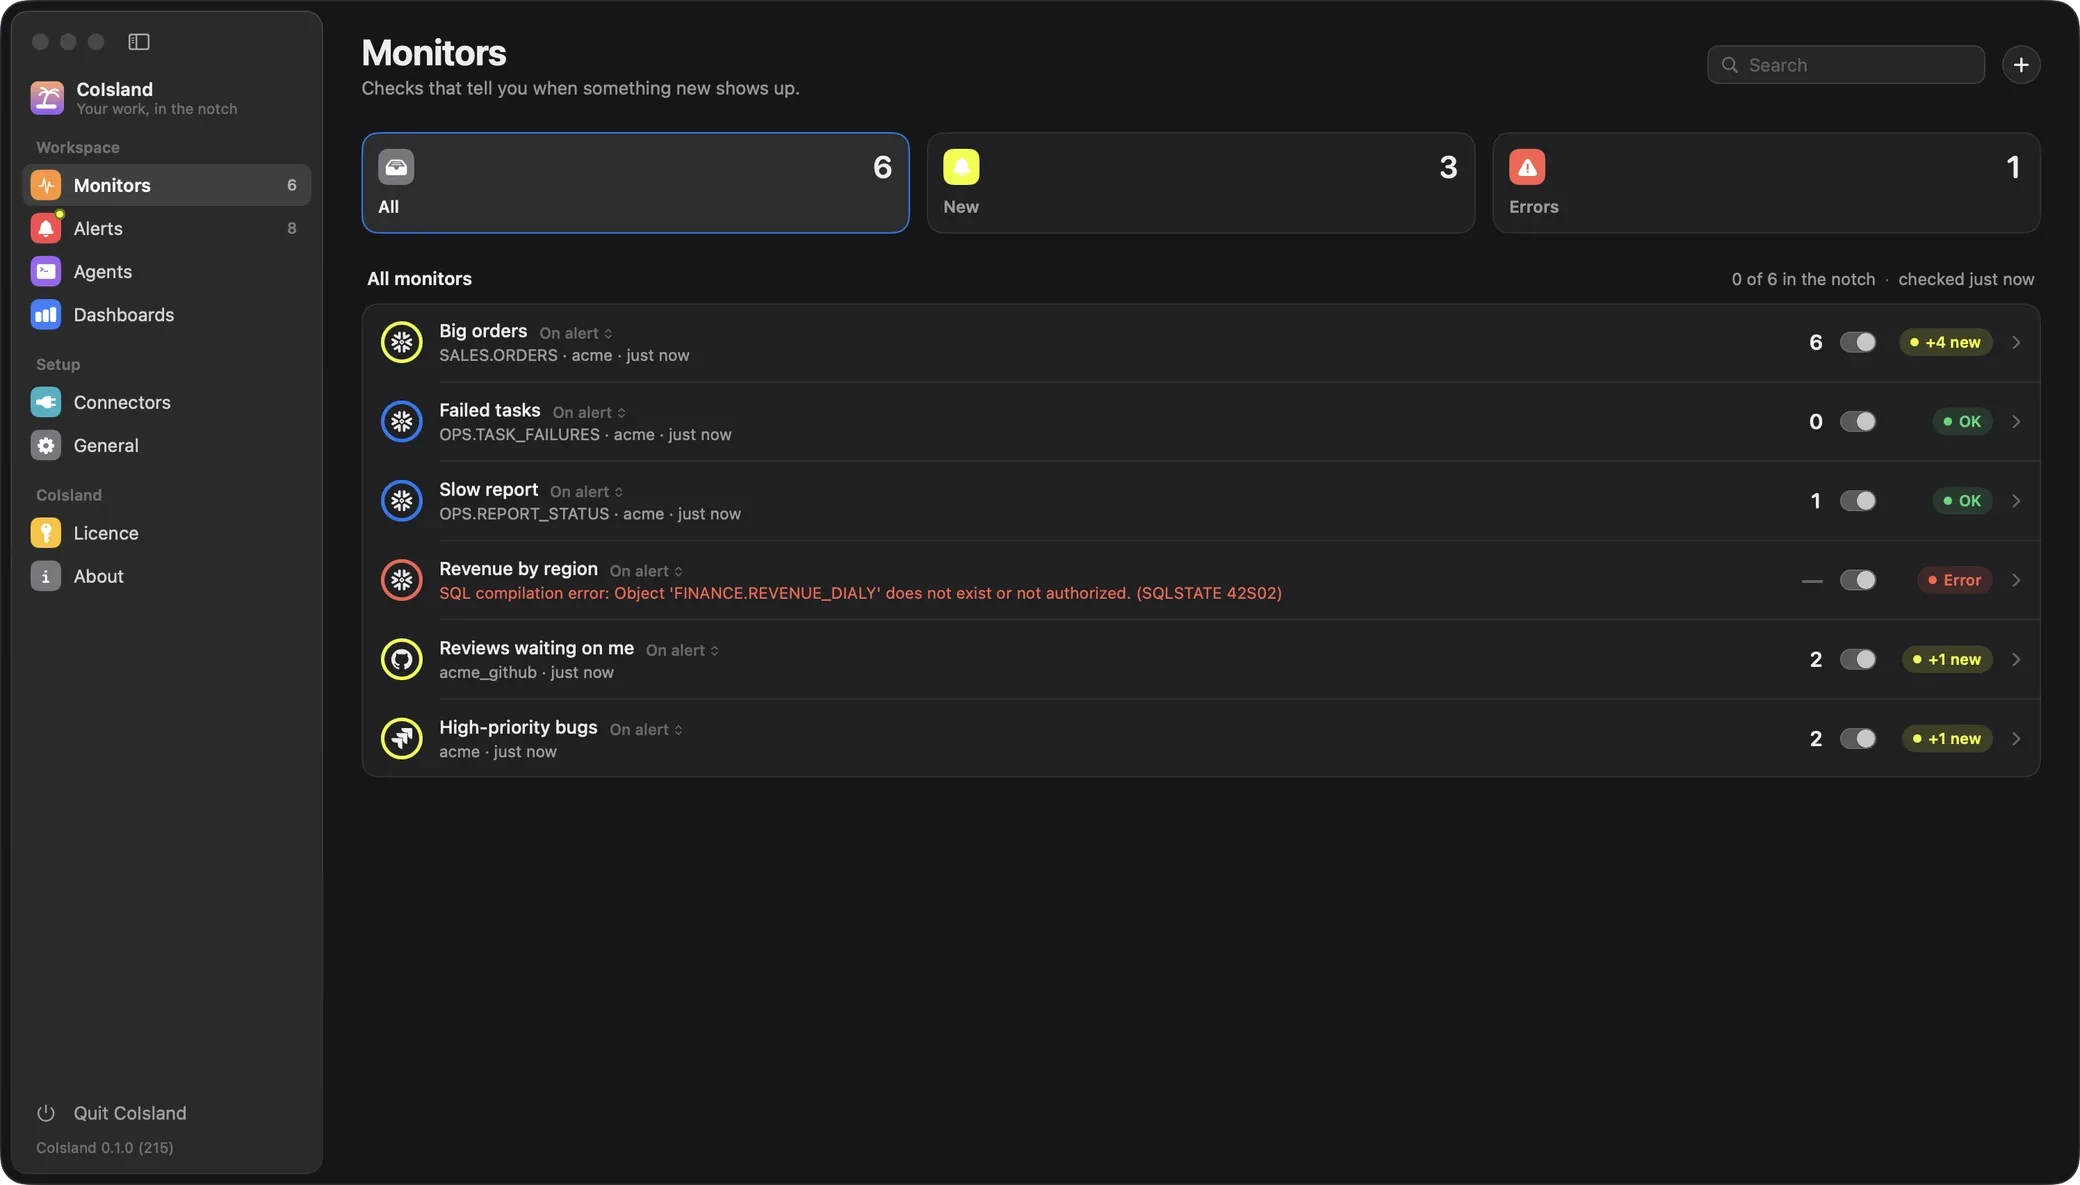
Move the pointer onto the pill at the edge of your screen: the island opens into a column of rings, one per monitor.
- The ring fills as the next check comes closer. The number under it is how many rows or items match, with
+Nwhile some are new; new ones turn it yellow. - Hover a ring for its card: the monitor, its connector and interval, the time to the next check, the new rows first, then the latest matches, and a button for each agent switched on in General › AI Agents (Claude, Codex and Cortex until you switch one off).
- Click a ring to open its newest new alert, or the monitor’s page when it has none. Press and hold it to mark its new rows as seen.
- When a row starts matching, the island opens on its own for five seconds and plays the monitor’s sound once.
Your first four monitors are set to Always in the notch; later ones to Only when it alerts, and join the island while they have new rows or an error. Change it from the menu next to a monitor’s name in Monitors. When more monitors want a ring than fit, a last ring counts the others and opens the list.
To move the island, open it, press the hand above its rings and drag it to the left, top or bottom edge. Option-drag slides it along its edge, and a click on an empty part of the open island pins it open. With more than one display, it stays on the main one, the one with the menu bar, whichever window is in front; pick another in Settings › General › Notch.

Your first alert
Each time a monitor fires, CoIsland raises an alert. Open it from the ring, or from Settings › Alerts, which keeps the 500 newest, grouped by day, with a filter by status and a search.
- Expected, Observed and Detected: the rule, what the check saw instead, and when.
- Rows that fired it, as they read at that moment, with Copy CSV. A GitHub or Jira alert shows its issues, pull requests or runs.
- Details: the monitor, the status, the rule and the connector.
- Activity: a log that starts with “Raised by” the monitor. Type in Add a note and press Return to add to it.
An alert is New until you click Acknowledge, then Resolve when it is handled; a resolved alert can be reopened, and each change goes into the activity log. Holding a monitor’s ring acknowledges its new alerts, and Acknowledge All in the menu bar does it for every monitor.
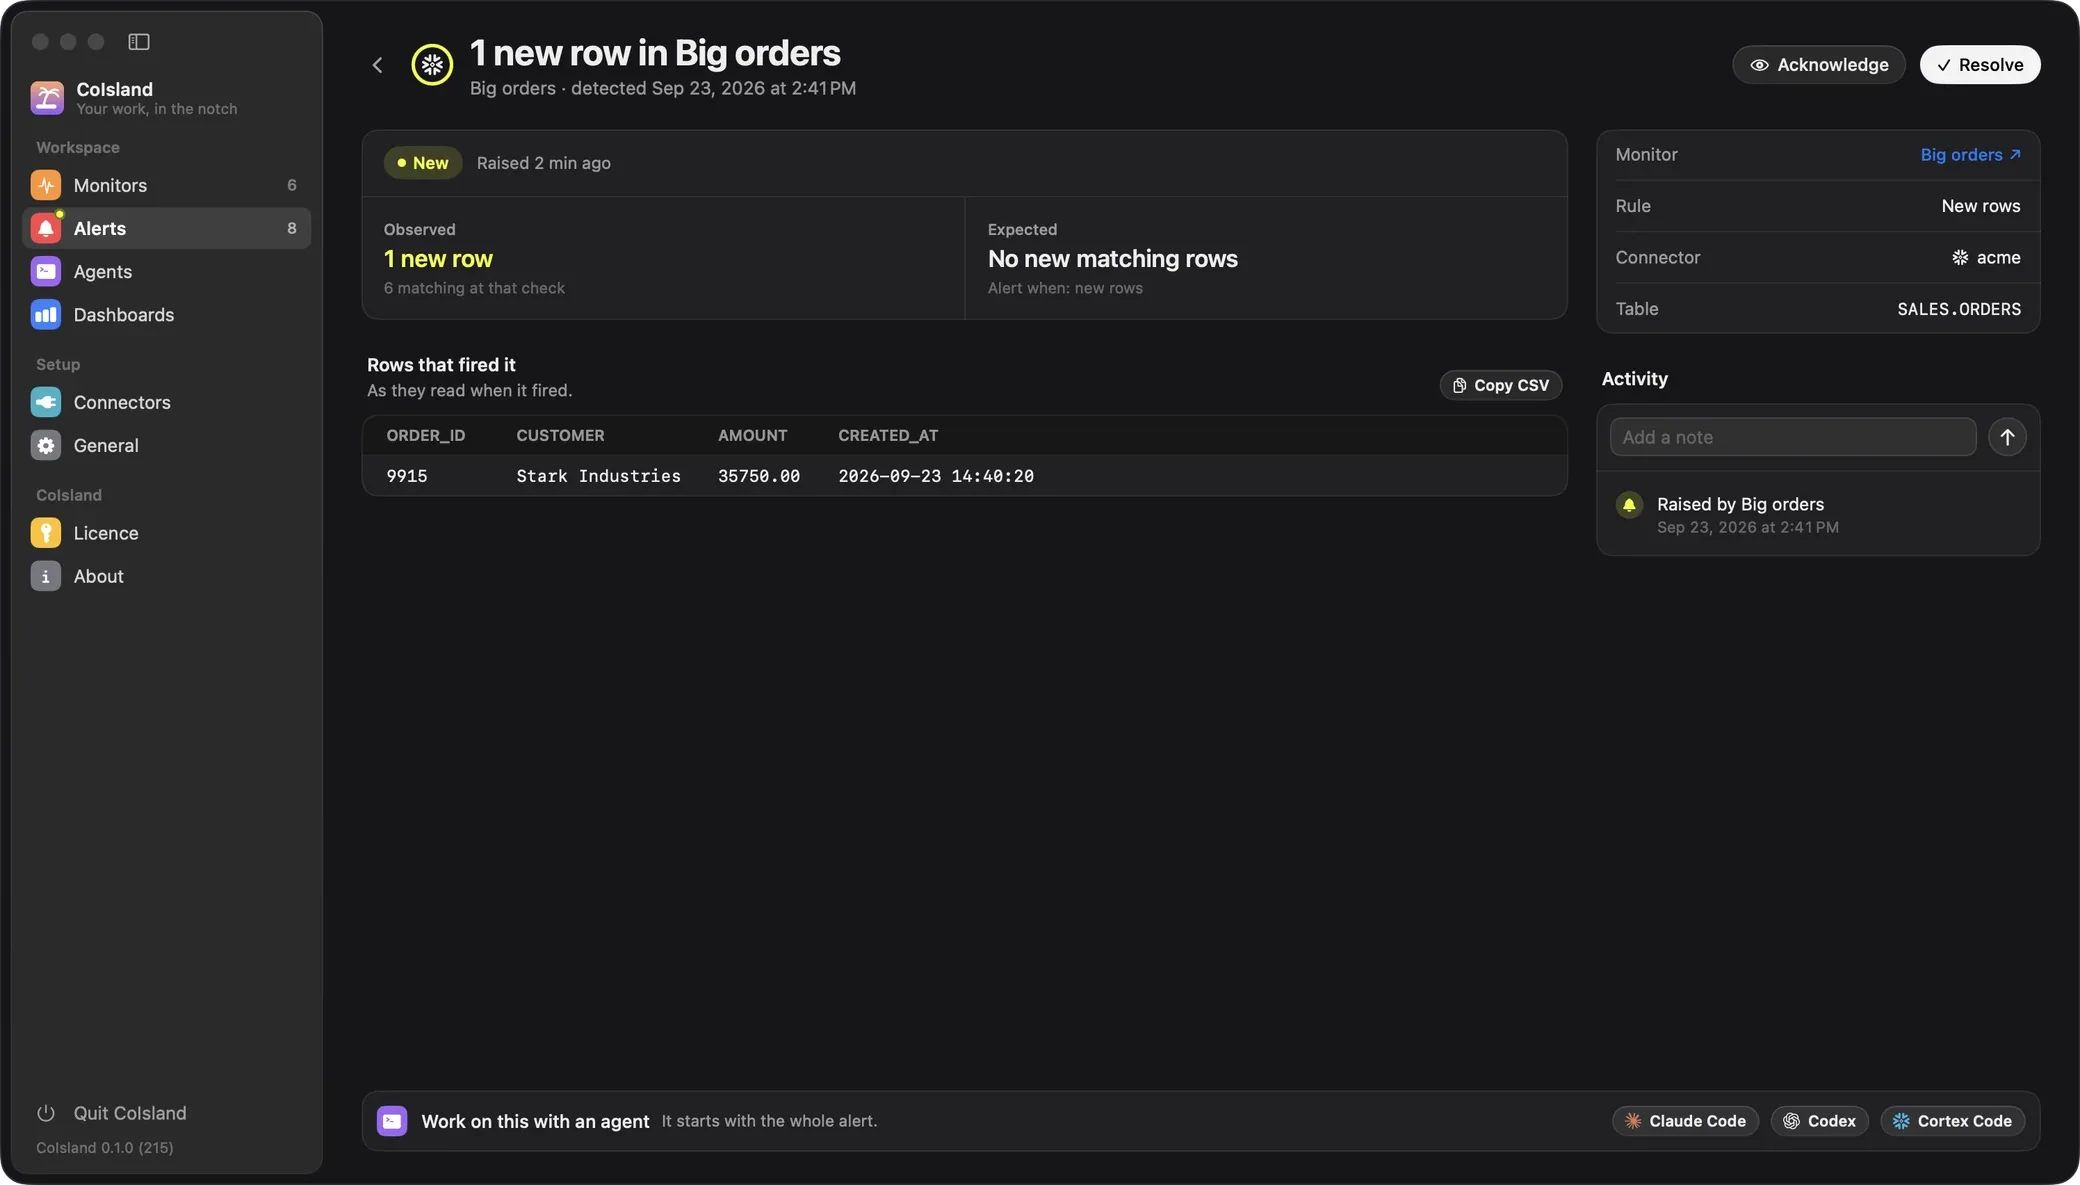
Want help with it? Work on this with an agent, at the foot of the alert page, starts Claude Code, Codex or Cortex Code in a terminal under the alert, the whole alert as its first message: its facts, the monitor’s query, the rows or items and the activity. Claude Code and Codex start in their auto modes: each fixes what is safe and asks you before anything destructive. None of them acknowledges or resolves the alert: you do. An agent that is not installed sends you to General › AI Agents; see Agents.
Troubleshooting
A connector does not connect
- “The token was refused. Check it has not expired or been revoked.” GitHub or Jira did not accept the token, at Test connector or at a check. Create a new token and test again.
- “Snowflake rejected the token (expired, revoked, wrong role, or the user has no network policy).” Check each cause in Connect Snowflake.
- Needs a token beside a connector in Connectors. Hover it for the reason. A Snowflake connection that signs in another way reads, for example,
Connection "my_conn" uses externalbrowser. CoIsland needs a programmatic access token (authenticator = "PROGRAMMATIC_ACCESS_TOKEN").
A monitor shows an error
- A red Error in Monitors, where the Errors filter lists them all. The reason is on the monitor’s line, and the monitor takes a ring in the island. Fix the query or the connector, then choose Check Now in the monitor’s right-click menu.
- “Watches only run SELECT, WITH or SHOW; this one starts with DELETE.” A Snowflake monitor can only read. Rewrite it as a query.
- “No GitHub connector yet. Add one in Settings › Connectors.” Add the connector, or pick another one under Runs on.
- “Not allowed. The token may lack a permission.” Give the token the read permission this monitor needs; see Connect GitHub or Connect Jira.
- “More than the 100 rows fetched match, so nothing is compared. Narrow the query.” A warning on a GitHub monitor’s card: its search matches more than the 100 items CoIsland compares. Add qualifiers until fewer match.
- Paused (licence) in Monitors: a monitor past the 2 you created first, with no licence key yet, or one no longer valid. Its card says what is holding it; open Settings › Licence.
Getting started with CoIsland: FAQ
Why did my first check not raise an alert?
With New rows appear, the first check only records what already matches. Only rows or items that start matching after it raise an alert. A threshold monitor fires on its first check if the threshold is already crossed.
Where is the island on my screen?
On the right edge at first, as a small pill that opens when the pointer reaches it. Carry it to the left, top or bottom edge with the hand above its rings. On the top edge of a Mac with a notch, it runs up to meet the notch. With more than one display, it stays on the main one, the one with the menu bar; choose another in Settings › General › Notch.
How often does CoIsland check my tools?
Every 15 minutes unless you choose otherwise, and at most 30 days apart. A watch file can go down to 30 seconds. Checks pause while your Mac sleeps, its screens are off or your session is locked.
Where does CoIsland keep my tokens?
On your Mac. Every connector’s token, Snowflake’s included, is in your login Keychain. There is no CoIsland server to send them to.
Can I edit a monitor outside the app?
Yes. Every monitor is a .sql file in ~/.coisland/watches, with its settings in comment lines at the top. Change the file and CoIsland picks up the change. See Watch files.
Can I see the welcome or the tour again?
Yes: open the welcome from Settings › About or the menu bar, and the tour from Take the Tour… in the menu bar.
Stuck? Open an issue on GitHub, or write to hello@coisland.app.